

If you trade the markets and want a simple, repeatable setup that captures expected trends, the Three Lines logic is worth mastering. This approach blends a money flow line, a direction line, and a trend line into one readable signal for short-term trading. Whether you trade futures on NSE or BSE or follow Nifty moves, this structure helps identify early entries, manage risk, and improve accuracy in intraday decisions for trading, stock market, NSE, BSE, Nifty.
Table of Contents
- 📈 What is the Three Lines logic and why it matters for trading, stock market, NSE, BSE, Nifty
- 🧭 How the three lines behave — read the signals
- ⚠️ Managing bumps and volatility — a three-minute frame advantage
- 🔁 Example flow: from color change to breakout
- 🛡️ Risk management and position sizing
- 🧩 ABCMP formula: additional filter for high-probability trades
- 🛠️ Tools, automations, and new features
- 📊 Real user example and practical outcome
- 📝 Step-by-step checklist for live trades
- 🔍 Common mistakes and how to avoid them
- 💡 Practical tips to speed up learning
- ❓FAQ
📈 What is the Three Lines logic and why it matters for trading, stock market, NSE, BSE, Nifty
Three Lines logic uses three independently coded indicators that run together to form a composite signal. Think of them as layers: a money flow line that captures early investor interest, a directional line that shows immediate momentum, and a trend line that confirms the larger direction. When these lines align or intersect in the right way, they provide a high-probability trigger for trades on short timeframes such as three minutes.
This setup is built to be simple but powerful. The money flow line often changes color first when buyers or sellers intensify. The direction line follows, and the trend line completes the picture. When all three line behaviors synchronize, the result is a clear signal that the market is preparing to move. For anyone focused on trading, stock market, NSE, BSE, Nifty, this is a practical pattern to watch.
🧭 How the three lines behave — read the signals
Here is the behavior to watch for on small intraday timeframes like three minutes.
- Money flow line: The first to change color. A green shift suggests buyers arriving; red indicates sellers. This is often the earliest clue of institutional or early investor activity.
- Direction line: Shows immediate price push. It can stick to the candlesticks and show short-term momentum. It confirms the intent hinted at by money flow.
- Trend line: The smoother, higher-level picture. When it aligns with money flow and direction, trend-following trades gain statistical edge.
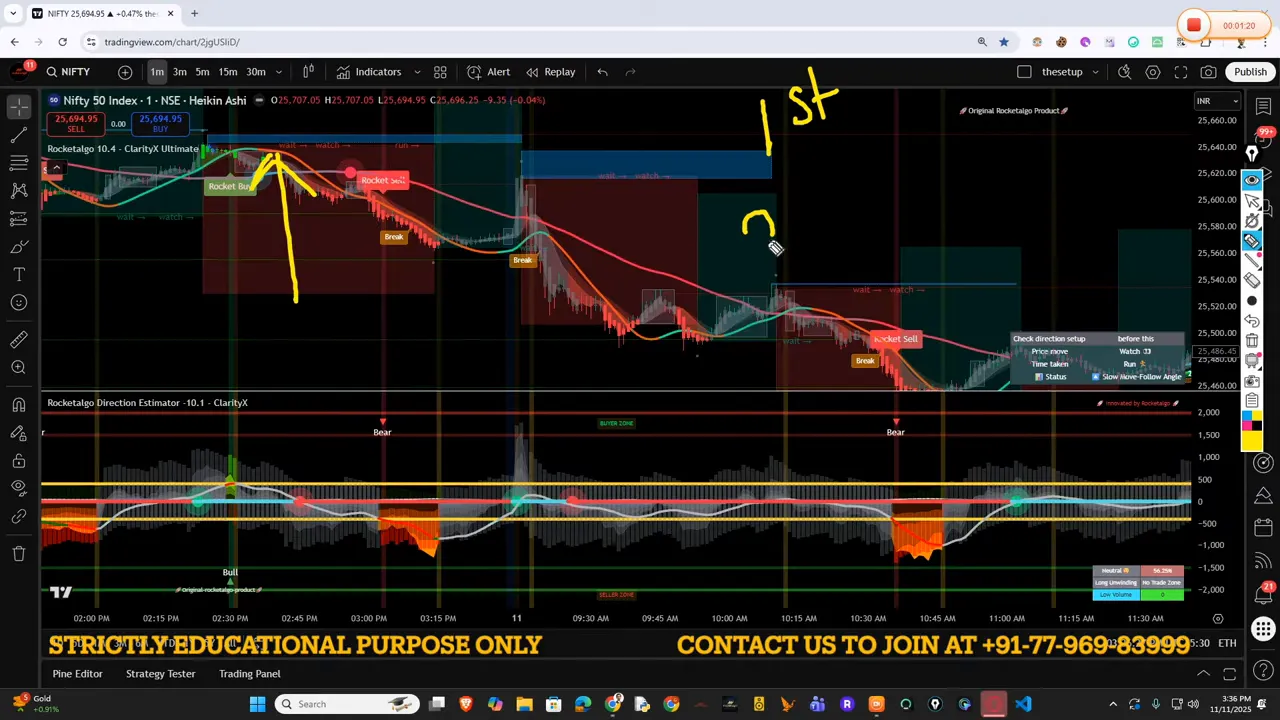
A typical sequence: money flow turns green, the direction line starts climbing, and the trend line begins to tilt upward. Intersection events between these lines often mark the pivot point for a breakout. When all three intersect and push in the same direction, that is commonly when the strongest entries occur for trading, stock market, NSE, BSE, Nifty.
⚠️ Managing bumps and volatility — a three-minute frame advantage
Markets are rarely smooth. Bumpy rides, sudden jags, and false starts are common. The three-minute timeframe helps because it filters some noise while keeping your entries timely. If you only trade longer frames you might miss short momentum bursts; on tick charts you may be overwhelmed by noise. The three-minute balance works well with the Three Lines logic.
When the market is bumpy, watch for repeated confirmations across the three lines instead of reacting to a single color change. A sequence of money flow green, direction lift, and trend tilt is your confirmation. If the lines keep oscillating or if the money flow line flips quickly back and forth, it is a sign to stay out or wait for a clearer alignment for trading, stock market, NSE, BSE, Nifty.
🔁 Example flow: from color change to breakout
Here is a common pattern that produces a clean setup.
- Money flow shifts to green, indicating buyers are entering the market.
- Direction line begins to follow upward; the price shows momentum.
- Trend line starts tilting and then intersects with the direction or money flow line.
- The intersected lines produce a breakout with sensitivity; you get the first high-probability trade.
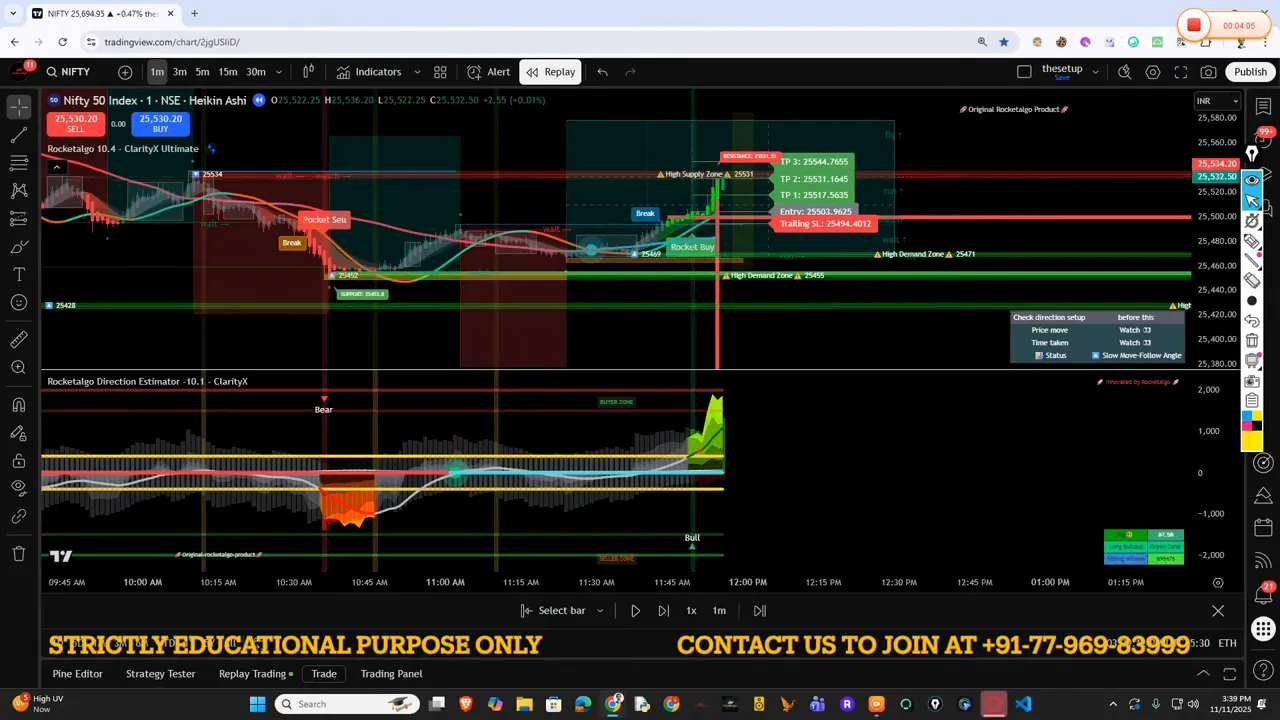
This exact sequence was observed during a gold trade example where an early money flow color change led the way and the combination produced a strong breakout. The same logic applies to equities and indices on NSE and BSE as well as to Nifty futures and options — the principle of early money flow followed by direction and trend is universal for trading, stock market, NSE, BSE, Nifty.
🛡️ Risk management and position sizing
A strategy is only as good as its risk management. With three-line signals, some trades will be high risk because early money flow can sometimes be misleading. Keep these risk-control rules:
- Use small initial size: When signals are early, scale in. For example, start with 0.10 lot or smaller for large accounts to limit drawdown while confirming the move.
- Know your lot value: One lot in many instruments equals significant monetary exposure. For example, a one-lot move could represent several hundred dollars. Position sizing must reflect volatility and account size.
- Set a stop and target: Use clear stop-loss and profit targets based on recent structure. Do not chase after a trade that loses its three-line alignment.
A practical example: on a three-minute signal with a proper setup, start with a controlled lot size (for instance 0.10). If the move confirms, you may add size. If it does not, you exit quickly. This preserves capital and improves long-term results for trading, stock market, NSE, BSE, Nifty.
🧩 ABCMP formula: additional filter for high-probability trades
Three Lines logic becomes more robust when combined with pattern recognition like an ABC move or percentage breakout filters. The ABCMP formula used as an overlay helps filter noise and increases the quality of signals. It looks for:
- ABC price structure points
- Momentum percentage thresholds
- Pattern confirmation aligned with the three lines
When ABCMP criteria line up with money flow color change and a trend intersection, you get a strong trigger that can act as a reliable entry for trading, stock market, NSE, BSE, Nifty.
🛠️ Tools, automations, and new features
A trading edge is more effective when paired with good tools. Useful developments include:
- In-app calendar and scheduling: Book quick review meetings or Q&A sessions with support and strategists through an in-app RocketAlgo icon.
- Alert bot with natural language cues: An alert bot can report money flow color changes in plain language like bullish possibility, neutral zone, or sell pressure, so you can act fast even when away from the screen.
- Model updates with animation: Visual animations make line interactions obvious and speed up pattern recognition during live market conditions.

These tools reduce hesitation, help with consistency, and ensure that new model updates are tested before being made public. Rely on well-tested deployments to avoid surprises when trading, stock market, NSE, BSE, Nifty.
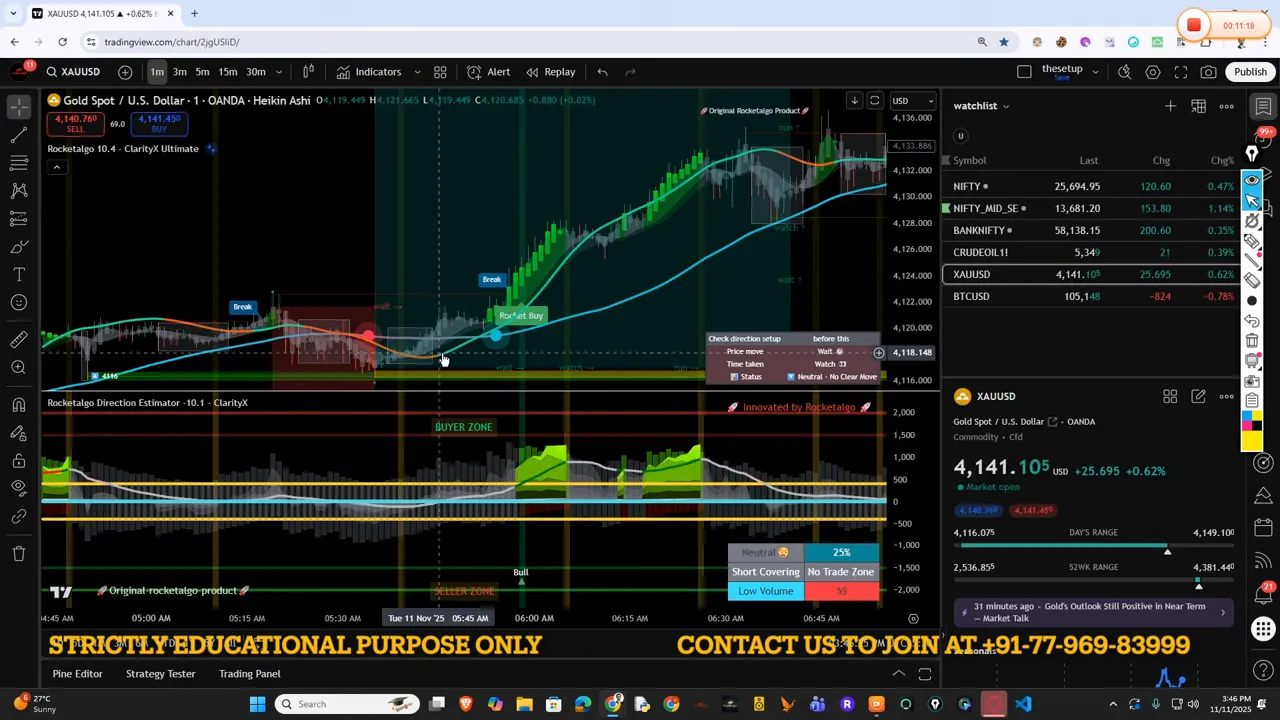
📊 Real user example and practical outcome
Users who applied the Three Lines logic on a three-minute frame reported steady micro-profits. One example from a gold session returned consistent gains on minimal risk when the Three Lines aligned. The user scaled appropriately and followed a disciplined stop-loss — the result was an improved accuracy and a modest, steady profit.
This demonstrates that the setup is not a lottery. When properly coded and combined with filters like ABCMP and solid risk controls, it becomes a repeatable approach for intraday work on indices and stocks across NSE and BSE and for Nifty trading, stock market, NSE, BSE, Nifty.
📝 Step-by-step checklist for live trades
Use this checklist before entering a trade:
- Confirm money flow color change in the direction of your intended trade.
- Wait for direction line to show momentum and not contradict money flow.
- Look for trend line tilt and intersection with other lines.
- Verify ABCMP filters or percentage breakout thresholds if available.
- Decide entry size, place stop-loss, and set profit target.
- Monitor alerts and adjust only if the three-line alignment breaks.

Adhering to this checklist helps you avoid impulsive trades and lets the system work for you, rather than the other way around. For anyone trading in the trading, stock market, NSE, BSE, Nifty space, discipline is the multiplier of any edge.
🔍 Common mistakes and how to avoid them
Many traders make avoidable errors when using line-based systems:
- Chasing early flips: Exiting or entering based on a single color change. Avoid this by waiting for at least two-line confirmation.
- Ignoring risk sizing: Taking large lots because the signal feels strong. Stick to position sizing rules.
- Skipping validation: Not checking ABCMP or percentage breakout filters that reduce false signals.
Fix these by creating a checklist, using alerts, and accepting a small number of missed trades to improve long-term performance in trading, stock market, NSE, BSE, Nifty.
💡 Practical tips to speed up learning
To get comfortable with the Three Lines logic:
- Backtest the sequence on three-minute charts across NSE, BSE, Nifty, and several liquid stocks.
- Use a demo account to practice position sizing and stop management without stress.
- Keep a trade journal that records why you entered, what lines showed, and how the trade ended.
These habits compress the learning curve and help you internalize the pattern recognition needed for consistent execution in trading, stock market, NSE, BSE, Nifty.
❓FAQ
How do I know which line changes first and why does it matter?
The money flow line usually changes first because it detects early liquidity and investor commitment. This early change matters because it signals that larger participants may be stepping in. When money flow leads and direction plus trend follow, it creates a higher-probability entry for trading, stock market, NSE, BSE, Nifty.
What timeframe is recommended for this setup?
Three minutes is recommended as the primary timeframe because it balances responsiveness and noise reduction. It works well for intraday moves on indices and liquid stocks on NSE and BSE and for Nifty futures, allowing quick confirmation of the three-line alignment.
How should I size positions when the signal appears?
Start conservatively. Use a fraction of your usual lot — for example 0.10 lot if a full lot is large for your account. Scale up only after the move confirms and your risk remains within acceptable limits. This minimizes drawdown while you learn the system in trading, stock market, NSE, BSE, Nifty.
Can this system be automated?
Yes. The Three Lines logic is suited for automation because the indicators are rules-based. Many users integrate alerts and bots that notify when money flow changes color and when line intersections occur. Always test and validate any automation thoroughly before going live.
What additional filters improve signal quality?
Combine the lines with ABCMP pattern checks, percentage breakout filters, and volume confirmation if available. These filters reduce false entries and improve accuracy in trading, stock market, NSE, BSE, Nifty.
If you build a routine around these principles, the Three Lines logic becomes a dependable addition to your trading toolkit. It is not magic, and it is not a guarantee. It is a disciplined pattern recognition system that helps uncover early institutional activity and aligns entries with momentum and trend.
For traders focused on intraday performance across the markets — whether equities on NSE and BSE or index trades in Nifty — this setup provides a practical, teachable method. Stick to the checklist, use strict risk controls, and add filters to increase accuracy. Over time, the small consistent edges stack into meaningful results.
Need more help |
|
Contact us by clicking the button below |
| Click me |

