

The markets move fast, and when you trade the trading, stock market, NSE, BSE, Nifty, having a simple, repeatable setup wins more than having a thousand indicators. This guide lays out a compact, actionable framework I use every session — the exact pattern recognition, multi-timeframe checks, and risk rules that keep trades consistent and testable.
Table of Contents
- 🔧 The simple rule that beats panic
- 🕒 Multi-timeframe checking — because one chart lies
- 📊 Colors, money flow, and the visual edge
- 📈 Pattern basics: CD candles, higher highs, lower lows
- 🪙 Example: Gold (XAU) breakout that worked
- 🛢️ Crude oil and macro context — why geopolitics matters
- ✅ Practical daily checklist before entering any trade
- ⚖️ Risk management and scaling
- 🔁 How to treat intraday whipsaws
- 📋 Setup in 60 seconds — a quick template
- 📣 Tools, alerts, and training
- 📈 Keyword focus for your strategy
- 🧰 Example trade log format
- ❓ Frequently Asked Questions
- 📌 Final checklist before you place an order
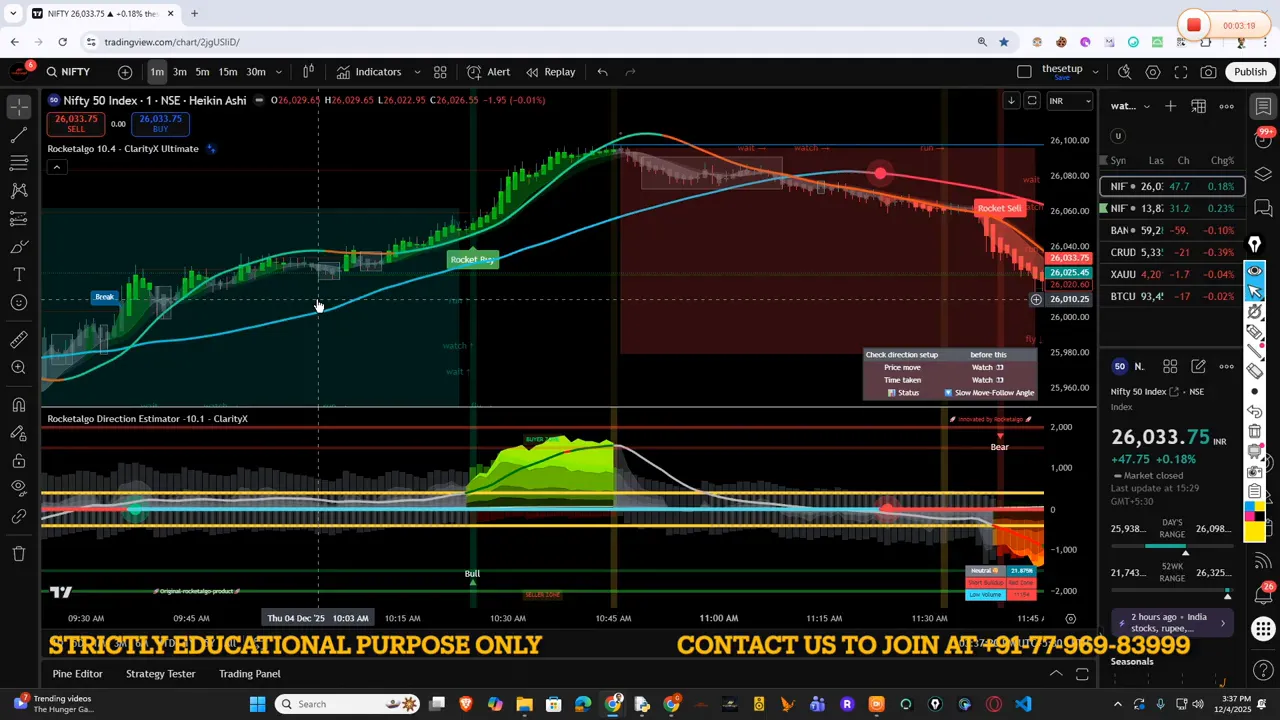
🔧 The simple rule that beats panic
A rule I follow every day: never take a trade immediately at the open. The first minutes are noise. Instead, wait for a clear directional structure — an angle — that shows one-way movement. When candles stop dancing up and down and start moving unidirectionally, the edge appears.
What I look for
- Angle — Price begins to trend in a single direction without chopping.
- Breakout — A clean breakout that follows the angle.
- CD candle behavior — Candles that steadily climb (or fall) in the pattern I expect.
- Money flow — A momentum line that supports the direction.
- Percentage movement — A reasonable projection for the move.
I run the checklist as ABCMP: Angle, Breakout, Candle (CD), Money flow, Percentage. When those align, the trade has statistical favor. If the angle does not form, there is no reason to force a trade.
🕒 Multi-timeframe checking — because one chart lies
Timeframes lie less when you cross-check them. If you see a trade set up on 1-minute, confirm it on 3-minute. If entering from 3-minute, glance at 5-minute. The higher timeframe should show the same CD-like climb or descent. If the smaller and higher timeframes contradict, skip or tighten risk.

Keyboard shortcut trick: switching timeframes quickly saves focus and prevents impulsive entries. Type the timeframe number and press enter and switch between 1, 3, and 5 minute charts in a second.
📊 Colors, money flow, and the visual edge
Colors are not decoration. I color-code angle, money flow, and formation for instant confirmation. When angle is green, money flow line is green, and the formation is green or blue, the probability of an uptrend is much higher. If they mismatch, the trade loses statistical strength.
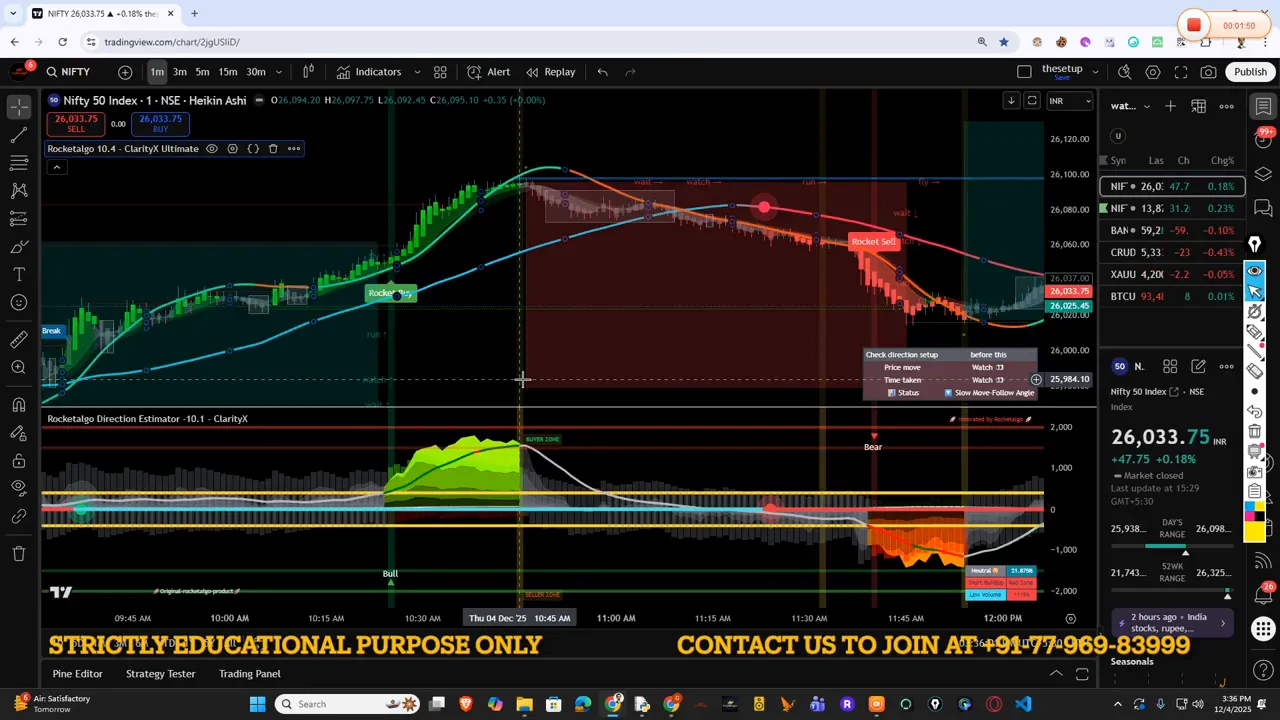
Our latest version of the tools emphasizes money flow first — the money flow line gives an advance hint. If the money flow turns red during a supposed bullish angle, it is a warning. Always check the money flow before assuming a trend.
📈 Pattern basics: CD candles, higher highs, lower lows
Forget complicated textbooks. The pattern I trade is simple: if candles move like C then D — stacking up consistently — you are building higher highs. That is a bullish pattern. If candles gradually step down, lower lows appear, and that is bearish. Look for rhythm in candle movement rather than poetic technical jargon.
If the angle forms but the money flow line is flashing red, do not enter. A green candle in a red zone is not confirmation; it can be a retracement or a bait before larger players push price the other way.
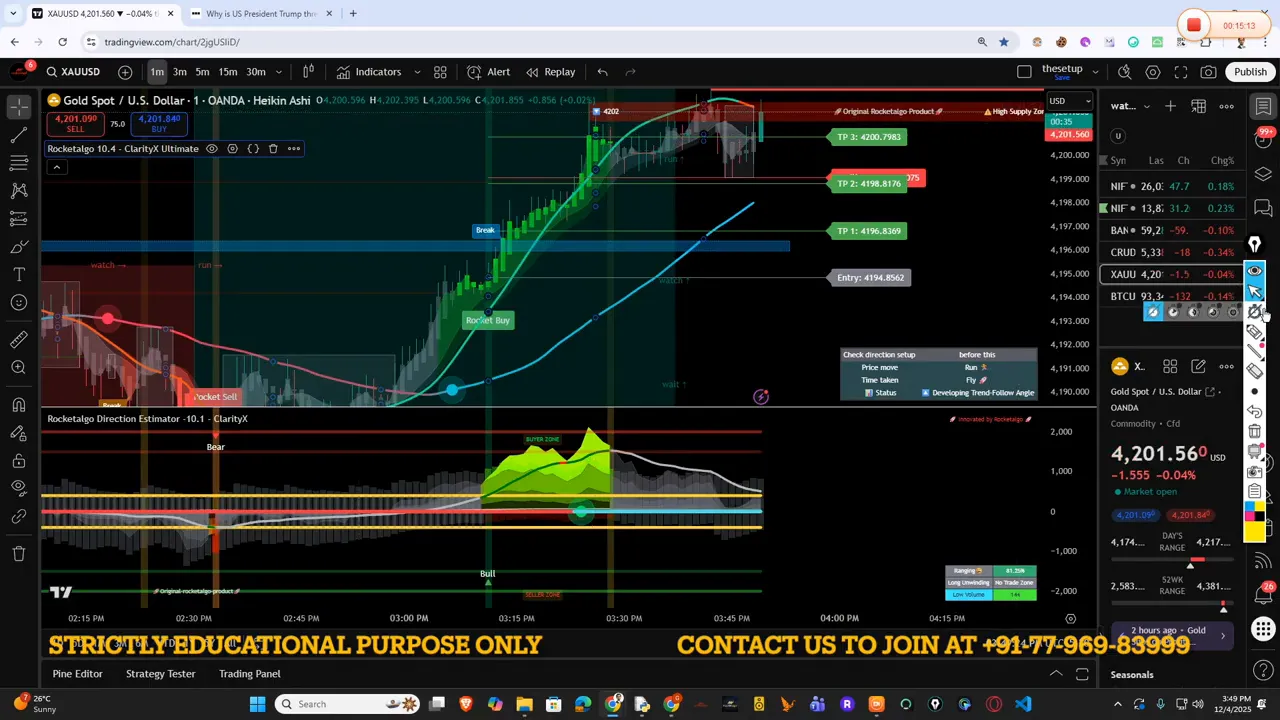
🪙 Example: Gold (XAU) breakout that worked
Here is a practical example to keep it real. A trade came where the money flow was green ahead of the breakout. The trend detector registered buying and then a clean breakout from 4194 to 4202. That move gave clean, measurable profit. On 0.1 lot, that was roughly 70 dollars; on 0.01 lot approximately 7 dollars. Small position sizes deliver meaningful edge while limiting risk.

This is why position sizing matters. If you place a 0.01 lot and risk a defined amount (for example 42 dollars per contract in that instrument), the reward can be scaled while your drawdown remains manageable.
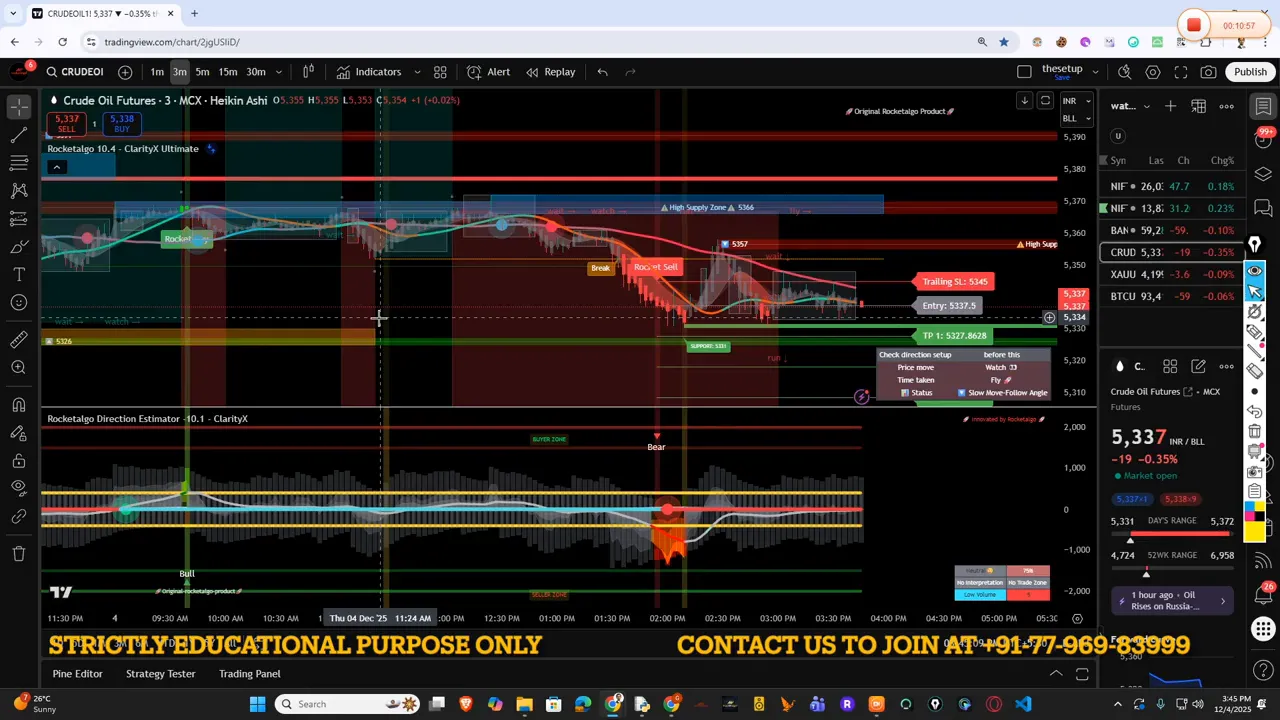
🛢️ Crude oil and macro context — why geopolitics matters
Crude oil rarely moves in isolation. Political events change the supply-demand balance and cause spikes or dumps. If two countries enter tension, safe haven and commodity flows change and gold reacts; if a meeting eases tension, oil can slow or pull back. Watch for these macro triggers and combine them with your ABCMP setup.
For example, when diplomatic activity between large producers and consumers happens, crude oil can be slow to react. That is a setup signal: when price is slow but your money flow and angle line up, you may get a delayed but strong move.
✅ Practical daily checklist before entering any trade
- Wait for the angle — No angle, no trade.
- Confirm money flow — It should align with the angle color (green for long, red for short).
- Check candles on 1, 3, 5 minute — Make sure the CD progression is consistent across timeframes.
- Check macro context — News, geopolitical tension, and big market events can change the rules.
- Position size — Keep lots small when testing or when market is uncertain. Scale up only when the formula proves consistent.
- Risk per trade — Treat trades as experiments: consistent 5 percent wins compound. Protect capital first.
⚖️ Risk management and scaling
Risk rules separate consistent traders from gamblers. Aim for small, repeatable wins that compound over time rather than chasing a single massive hit. If your edge produces consistent 5 percent gains on a small risk, that builds into a profitable portfolio over weeks and months.
If your tools produce a high-probability signal and you are sure on ABCMP, you can scale your lot. But the first attempts should use small lots to confirm that the live market behaves like the backtest. Once you have multiple verified wins with the setup, increase scale gradually.
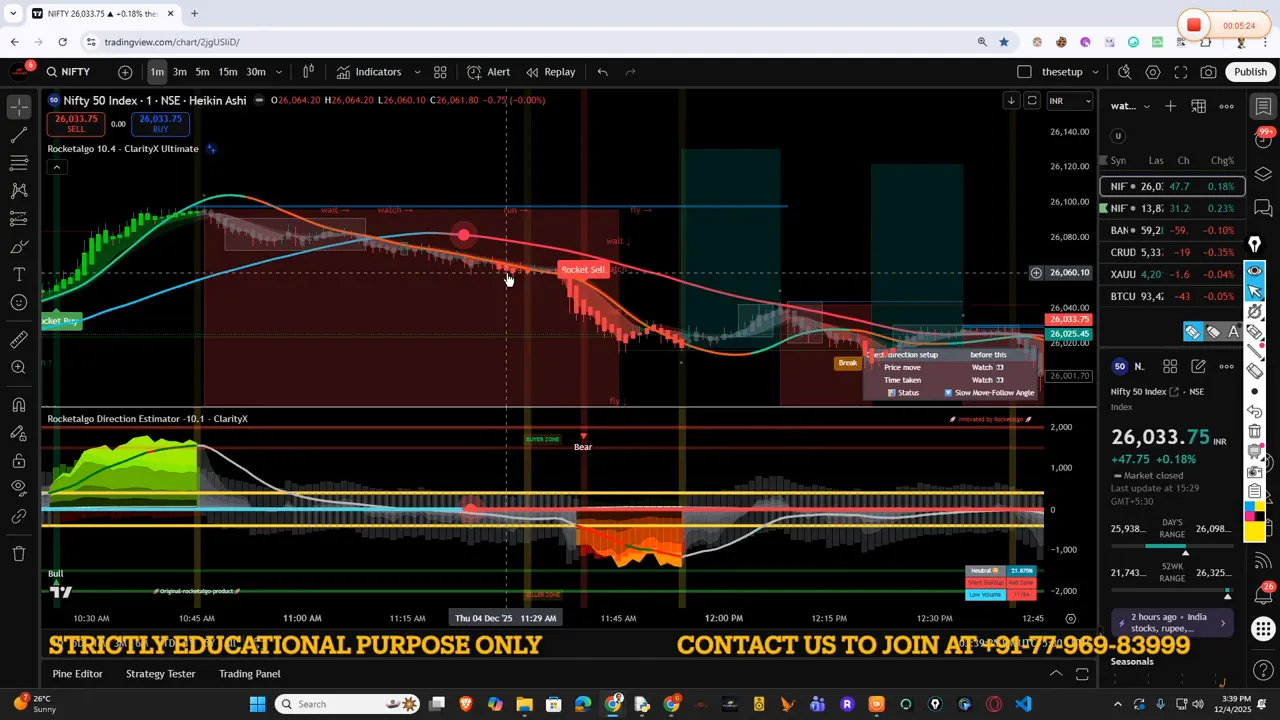
🔁 How to treat intraday whipsaws
When the market flutters between buyers and sellers, do not fight it. If angle forms but the zone turns red and green candles print in that red zone, it is typically a sign of distribution. Large players can be rotating positions. In such environments, skip entries or tighten stop losses.
An example: if a bullish angle starts but money flow flips red, the smart move is to either reduce the position size or not trade. The formation may still look bullish on a small timeframe but the higher timeframe will often reveal the true direction.
📋 Setup in 60 seconds — a quick template
- Check higher timeframe (5-min) for direction.
- Switch to 3-min; confirm CD candles stacking in the same direction.
- Look at 1-min for precise entry once 3-min agrees.
- Confirm money flow color and angle color alignment.
- Place entry with predetermined stop and target based on percent move.
- Scale or exit based on momentum and price reaction to levels.
📣 Tools, alerts, and training
Automating alerts for money flow flips or angle formation reduces cognitive load. Set simple alerts for when the money flow line turns green or red, and cross-check the ABCMP checklist before acting. Also, if you want a trainer to walk you through the setup personally, a short guided session can speed up the learning curve.
📈 Keyword focus for your strategy
Keep these keywords in mind as you build your trading diary: trading, stock market, NSE, BSE, Nifty, money flow, angle, breakout, CD pattern, multi-timeframe. Logging trades with these tags helps you analyze which parts of the setup produce the most return.
🧰 Example trade log format
- Date and time
- Instrument (Nifty, Bank Nifty, Gold, Crude)
- Timeframes checked (1, 3, 5 min)
- ABCMP status
- Entry, stop, target
- Outcome and notes
Review trades weekly. Look for patterns: did trades lose money when money flow disagreed? Did higher timeframe mismatches cause the greatest drawdowns? That feedback loop will refine your edge faster than theory alone.
❓ Frequently Asked Questions
How soon after market open should I look for trades?
Wait for the initial 10 to 20 minutes of price discovery to settle. Focus on when a clear angle forms and ABCMP aligns across 1, 3, and 5 minute charts. The first move is often noise; your strategy profits when you respect early volatility.
What is the ABCMP rule and how do I apply it?
ABCMP stands for Angle, Breakout, Candle behavior (CD), Money flow, Percentage target. Apply it as a checklist: confirm angle, wait for breakout, check candle rhythm, ensure money flow supports the move, and have a percentage-based target or stop. If any part fails, skip the trade.
Do I need special software to see money flow and angles?
No special proprietary software is required but use tools that plot money flow lines and let you color-code your angle and formation. Most charting platforms allow custom indicators or overlays. The key is consistency in readings across timeframes.
How large should my initial position be?
Start small. Use position sizes that, if you lose, do not affect your psychology. Many start with micro lots or 0.01 lots in commodities and scale only after consistent wins. Risk per trade should be a small percentage of your capital.
How do macro events affect intraday setups?
Macro events can amplify or negate intraday setups. Geopolitical tension, news from key countries, and commodity supply changes can cause sudden moves. Combine event awareness with ABCMP; if an event is in play, increase caution or reduce size.
📌 Final checklist before you place an order
- Angle confirmed on higher timeframe
- Money flow aligned
- CD candles stacking on 1/3/5 min
- Predefined stop and reward ratio
- Position size fits risk plan
- No conflicting macro event
Follow these rules consistently and the quality of your trades will improve. This is the foundation for profitable intraday trading on indexes and commodities like Nifty, Bank Nifty, gold, and crude oil. Keep a clean checklist, review trades methodically, and always protect capital.
If you want structured guidance, consider a short live session with a trainer to run through the setup on your charts. Small investments in disciplined learning pay off faster than chasing every market rumor.
Contact details for coaching and resources are available if you prefer guided onboarding. Trade safely and keep refining the process.
Need more help |
|
Contact us by clicking the button below |
| Click me |

