
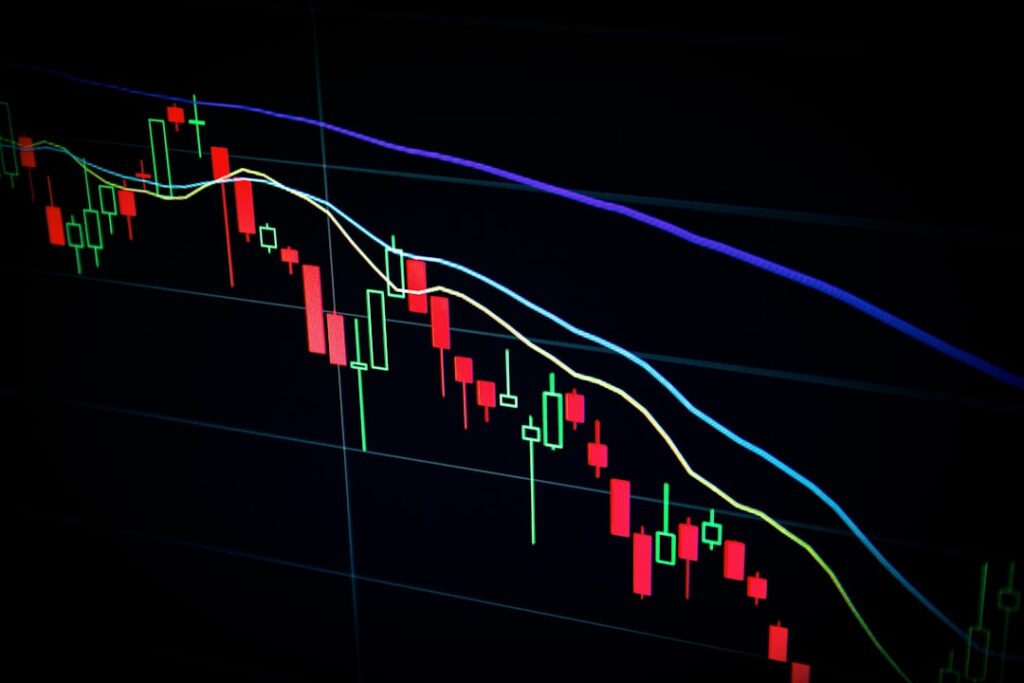
Swing trading, a dynamic approach to the financial markets, sits comfortably between the frantic pace of day trading and the patient horizon of long-term investing. It’s about capturing short-to-medium term price swings, typically holding positions for a few days to a few weeks. Success in this arena hinges on the astute application of technical analysis, and at the heart of technical analysis lies the indicator. These mathematical tools, derived from price and volume data, offer glimpses into market sentiment, momentum, and potential turning points. For the aspiring or seasoned swing trader, selecting the “best” indicators can feel like navigating a vast ocean of information. This article will delve into a curated selection of powerful indicators, examining their application across stocks, forex, and cryptocurrencies, empowering you to make more informed trading decisions.
Before diving into specific indicators, it’s crucial to grasp the underlying principles that make them effective for swing trading. Swing traders seek to identify trends that are in progress but are not yet mature, and then profit from the subsequent movement. Indicators help them achieve this by:
Identifying Trend Strength and Direction
One of the primary goals of swing trading is to ride existing trends. Indicators that can reliably signal the strength and direction of a trend are invaluable. These tools help traders differentiate between genuine uptrends or downtrends and temporary pullbacks or consolidations.
Gauging Momentum
Momentum indicators measure the speed and strength of price changes. For swing traders, understanding momentum can help identify potential trend reversals or continuations. A surge in momentum might signal an opportunity to enter a trade, while a loss of momentum could indicate a need to exit.
Spotting Overbought and Oversold Conditions
These indicators help identify when an asset’s price has moved too far, too fast, in either direction, suggesting a potential reversal. While not foolproof, they can provide valuable context for entry and exit points, especially when used in conjunction with other signals.
Confirming Price Action
No indicator should be used in isolation. The most effective approach involves using indicators to confirm signals generated by price action itself. This means looking for convergence between what the charts are showing and what the indicators are suggesting.
Adaptability Across Markets
While the fundamental principles remain the same, the nuances of each market—stocks, forex, and cryptocurrencies—can influence indicator performance. Understanding these differences is key to optimizing their application.
Leading vs. Lagging Indicators: A Swing Trader’s Perspective
A fundamental distinction in technical analysis is between leading and lagging indicators. For swing traders, both have their place, but a well-rounded strategy often emphasizes a blend.
Leading Indicators: Forecasting the Future
Leading indicators aim to predict future price movements by analyzing data that precedes price changes. They are forward-looking and can offer an edge by signaling potential opportunities before they fully materialize.
- Pros: Can provide early entry or exit signals, potentially capturing larger portions of a move.
- Cons: Can generate more false signals (whipsaws), requiring careful confirmation.
Lagging Indicators: Confirming the Past
Lagging indicators, on the other hand, are based on past price and volume data. They confirm trends and momentum that have already begun to develop.
- Pros: Generally more reliable once a trend is established, offering fewer false signals.
- Cons: Signals are generated after the price move has already started, potentially leading to missed opportunities or entering at less favorable prices.
For swing traders, the ideal scenario is to use leading indicators for potential early entry signals and then employ lagging indicators for confirmation of the trend’s strength and direction before committing to a larger position.
Key Indicators for Swing Trading: A Deep Dive
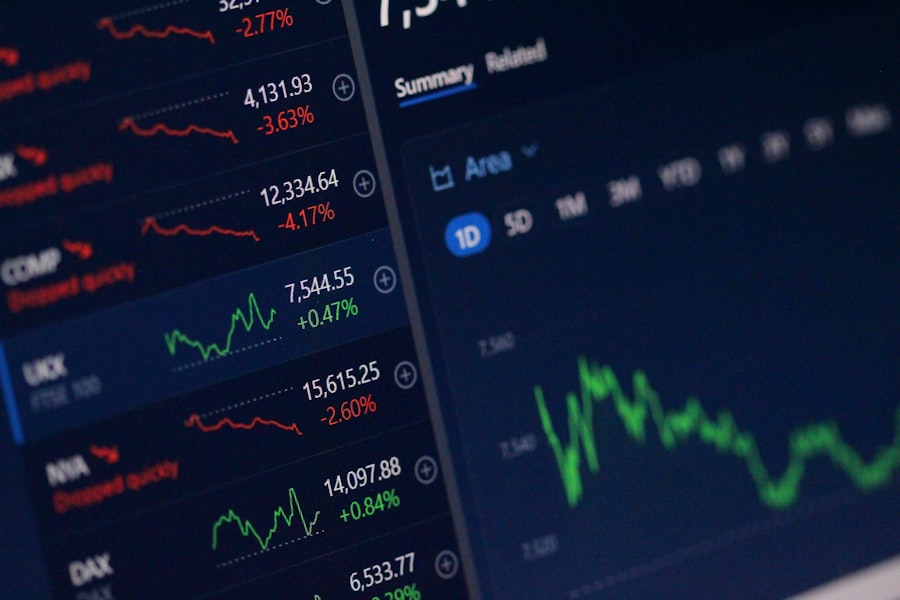
Now, let’s explore some of the most impactful indicators that consistently prove their worth in swing trading across different asset classes.
Moving Averages: The Foundation of Trend Following
Moving averages are arguably the most fundamental and widely used indicators in technical analysis. They smooth out price data to create a single flowing line, making it easier to identify trends and potential support/resistance levels.
Simple Moving Average (SMA)
The SMA calculates the average price of an asset over a specified period. For example, a 50-day SMA is the average closing price of the last 50 trading days.
- Application in Swing Trading:
- Trend Identification: When the price is consistently above a moving average (e.g., 50-day or 200-day), it suggests an uptrend. Conversely, being below indicates a downtrend.
- Support and Resistance: Moving averages can act as dynamic support and resistance levels. Prices often bounce off these lines during uptrends (support) and struggle to break through them during downtrends (resistance).
- Crossovers: A common strategy involves using two moving averages of different lengths (e.g., 50-day and 200-day). A bullish signal is generated when the shorter-term moving average crosses above the longer-term one, and a bearish signal when it crosses below. This is often referred to as the “golden cross” and “death cross.”
- Stocks: Widely used to identify intermediate and long-term trends in individual stocks.
- Forex: Effective for identifying major currency pair trends, especially on daily and weekly charts.
- Crypto: Can be volatile, so longer-term SMAs (e.g., 200-day) can be more reliable for trend identification, while shorter-term ones can signal momentum shifts.
Exponential Moving Average (EMA)
The EMA gives more weight to recent prices, making it more responsive to current market conditions than the SMA. This can be advantageous for swing traders who need to react quickly to changing price action.
- Application in Swing Trading:
- Faster Signals: Due to its responsiveness, EMAs can generate earlier buy and sell signals compared to SMAs.
- Trend Confirmation: Similar to SMAs, EMAs can act as support and resistance and are used in crossover strategies. Traders often use EMAs for shorter-term trends (e.g., 12-day, 26-day) in conjunction with longer-term SMAs for overall trend direction.
- Stocks, Forex, Crypto: EMAs are particularly useful for swing traders who want to capitalize on shorter-term trends and react to market shifts more promptly. They are often favored for identifying entry and exit points within a broader trend.
The Relative Strength Index (RSI): Gauging Overbought and Oversold Conditions
The RSI is a momentum oscillator that measures the magnitude of recent price changes to evaluate overbought or oversold conditions in the price of an asset. It oscillates between 0 and 100.
- Understanding the Levels:
- An RSI reading above 70 is generally considered overbought, suggesting that the asset’s price may be due for a pullback.
- An RSI reading below 30 is generally considered oversold, indicating that the asset’s price may be due for a bounce.
- Application in Swing Trading:
- Entry and Exit Signals: Traders look for divergences between the RSI and price action. For instance, if the price makes a new high but the RSI makes a lower high, it’s a bearish divergence, suggesting potential weakness. Conversely, if the price makes a new low but the RSI makes a higher low, it’s a bullish divergence, indicating potential strength.
- Trend Confirmation: While often used for reversal signals, RSI can also confirm existing trends. In an uptrend, the RSI will typically stay above 50, and in a downtrend, it will remain below 50.
- Stocks: Useful for identifying short-term reversals and confirming the strength of price movements.
- Forex: Particularly effective in currency pairs that tend to range trade, where overbought/oversold conditions can be more pronounced.
- Crypto: Given the high volatility of cryptocurrencies, RSI can provide valuable insights into potential short-term overextensions. However, it’s important to note that in strong trending crypto markets, RSI can remain in overbought or oversold territory for extended periods.
MACD (Moving Average Convergence Divergence): Trend and Momentum Synthesis
The MACD is a trend-following momentum indicator that shows the relationship between two moving averages of a security’s price. It is comprised of three components: the MACD line, the signal line, and the histogram.
- Components Explained:
- MACD Line: The difference between a 12-period EMA and a 26-period EMA.
- Signal Line: A 9-period EMA of the MACD line.
- Histogram: The difference between the MACD line and the signal line, plotted as bars.
- Application in Swing Trading:
- Crossovers: When the MACD line crosses above the signal line, it’s considered a bullish signal. When it crosses below, it’s a bearish signal. These crossovers often precede price movements.
- Divergences: Similar to RSI, MACD divergences can signal potential trend reversals. A bullish divergence occurs when the price makes a new low, but the MACD makes a higher low. A bearish divergence happens when the price makes a new high, but the MACD makes a lower high.
- Zero Line Crossovers: When the MACD line crosses above the zero line, it suggests a bullish shift in momentum. Crossing below the zero line indicates bearish momentum.
- Stocks: A popular choice for identifying both short-term and medium-term trend changes and momentum shifts.
- Forex: Works well for confirming trends and identifying potential turning points in major currency pairs.
- Crypto: Can be a robust indicator in crypto markets, helping to identify the start and end of significant price movements. The histogram is particularly useful for visualizing accelerating or decelerating momentum.
Bollinger Bands: Volatility and Price Ranges
Bollinger Bands consist of three lines plotted in relation to a security’s price: a simple moving average (typically 20 periods) and two standard deviation bands above and below the moving average.
- Understanding the Bands:
- The middle band represents the trend.
- The upper band acts as a dynamic resistance level.
- The lower band acts as a dynamic support level.
- Application in Swing Trading:
- Volatility Measurement: The distance between the bands widens during periods of high volatility and narrows during periods of low volatility. This “squeeze” can precede significant price moves.
- Overbought/Oversold Signals: When the price touches or crosses the upper band, it can signal overbought conditions, suggesting a potential pullback. When the price touches or crosses the lower band, it can signal oversold conditions, indicating a potential bounce.
- Trend Confirmation: In an uptrend, prices tend to hug the upper band. In a downtrend, they tend to hug the lower band.
- Stocks: Useful for identifying potential entry and exit points based on price retracements and breakouts from consolidation periods.
- Forex: Can be effective in identifying currency pairs that are experiencing increased volatility and potential reversal points.
- Crypto: Excellent for capturing the often-extreme price swings in cryptocurrencies. The bands can help identify when prices are stretched and due for a reversion, or when a breakout is imminent after a period of consolidation.
Stochastic Oscillator: Identifying Potential Reversals
The Stochastic Oscillator is another momentum indicator that compares a security’s closing price to its price range over a given period. It also oscillates between 0 and 100.
- Key Features:
- %K Line: The primary line, representing the current closing price relative to the high-low range.
- %D Line: A moving average of the %K line, acting as a signal line.
- Application in Swing Trading:
- Overbought/Oversold Signals: Similar to RSI, readings above 80 are considered overbought, and readings below 20 are considered oversold.
- Crossovers: A bullish signal is generated when the %K line crosses above the %D line, especially within the oversold territory. A bearish signal is when the %K line crosses below the %D line, particularly in overbought territory.
- Divergences: Stochastics can also show divergences with price action, signaling potential reversals.
- Stocks: Can be helpful for identifying short-term reversals and profit-taking opportunities.
- Forex: Works well in identifying currency pair reversals, especially when used in conjunction with trend-following indicators.
- Crypto: The Stochastic Oscillator can be quite sensitive to price movements in crypto markets, making it useful for identifying potential short-term overextensions and reversals in this highly volatile asset class.
Combining Indicators for Enhanced Decision-Making
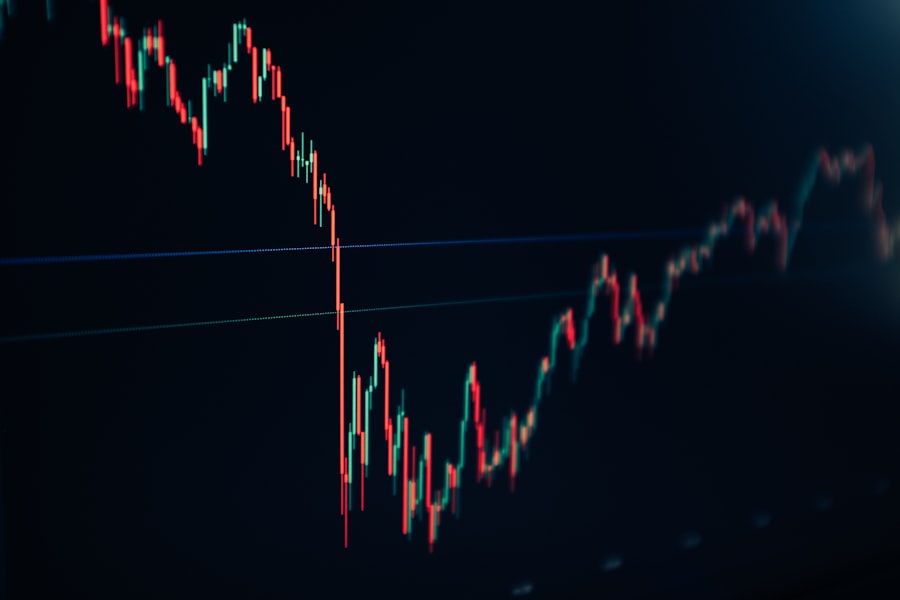
The true power of technical indicators lies not in their individual prowess but in their synergistic application. Swing traders who excel are those who can effectively combine multiple indicators to confirm signals and build a higher probability trading strategy.
The Power of Confluence
Confluence occurs when multiple indicators provide the same or similar signals. For example, if the price is approaching a support level, the RSI is showing bullish divergence, and the MACD is showing a bullish crossover, this confluence of signals significantly increases the probability of a successful trade.
Strategies for Combining Indicators
- Trend Identification + Momentum: Use a moving average to identify the overall trend and then employ an RSI or MACD to gauge the strength of that trend or identify potential entries within the trend.
- Volatility Breakout + Trend Confirmation: Look for a Bollinger Band squeeze to indicate potential volatility expansion, and then use a moving average crossover or MACD signal to confirm the direction of the breakout.
- Reversal Signals + Confirmation: Identify potential overbought/oversold conditions with RSI or Stochastic, and then wait for price action to confirm the reversal, perhaps by breaking a short-term trendline or moving average.
Considerations for Different Markets
- Stocks: Often exhibit clearer trends and are less prone to extreme short-term volatility compared to crypto. A combination of trend-following (moving averages) and momentum (MACD) indicators can be very effective.
- Forex: Currency pairs can have distinct characteristics. Some tend to be more trend-driven, while others are more range-bound. Understanding the typical behavior of a currency pair can help in selecting and combining indicators. For example, in range-bound pairs, oscillators like RSI and Stochastic might be more useful.
- Crypto: The inherent volatility of cryptocurrencies necessitates a more robust approach. Using longer-term moving averages for overall trend, alongside RSI and MACD for momentum and potential overextensions, can be beneficial. It’s also crucial to acknowledge that crypto markets can experience parabolic moves where indicators might remain in extreme zones for extended periods.
Common Pitfalls to Avoid
| Indicator | Category | Use |
|---|---|---|
| Simple Moving Average (SMA) | Trend | Identify trend direction |
| Exponential Moving Average (EMA) | Trend | Identify trend strength |
| Relative Strength Index (RSI) | Momentum | Identify overbought or oversold conditions |
| MACD (Moving Average Convergence Divergence) | Momentum | Identify trend changes and momentum shifts |
| Bollinger Bands | Volatility | Identify potential price reversals |
Even with the best indicators, swing trading is not without its challenges. Experienced traders are aware of and actively avoid common pitfalls.
Over-Reliance on a Single Indicator
As mentioned, no indicator is perfect. Relying solely on one tool can lead to missed opportunities or costly false signals. Always seek confirmation from price action and other indicators.
Trading Against the Trend
While identifying reversals is a part of swing trading, attempting to short an asset in a strong uptrend or buy in a strong downtrend is a recipe for disaster. Always identify the dominant trend first.
Ignoring Market Sentiment and News
Technical indicators are based on price and volume, but external factors like news events and broader market sentiment can significantly influence price. Be aware of the macroeconomic environment.
Inconsistent Application of Strategies
The effectiveness of indicators often depends on consistent application. Stick to your trading plan and the rules you’ve set for using specific indicators.
Emotional Trading
Fear and greed can lead to impulsive decisions. Having a well-defined strategy with clear entry and exit points can help mitigate emotional trading.
Conclusion: Crafting Your Indicator Toolkit
The journey to becoming a successful swing trader is one of continuous learning and refinement. The indicators discussed in this article—Moving Averages, RSI, MACD, Bollinger Bands, and Stochastic Oscillator—form a powerful foundation for any swing trader’s toolkit. Remember that the “best” indicators are those that align with your trading style, the specific market you’re trading, and your ability to interpret their signals effectively.
By understanding the core principles of swing trading, differentiating between leading and lagging indicators, and learning to combine multiple tools for confluence, you can significantly enhance your decision-making process. Practice diligently, backtest your strategies, and most importantly, approach the markets with discipline and patience. The world of swing trading offers exciting opportunities, and with the right indicators and a well-honed strategy, you can navigate its currents with greater confidence and success across stocks, forex, and cryptocurrencies.

