
Understanding the Language of the Market: An Indian Retailer’s Guide to Candlestick Patterns
For the burgeoning community of Indian retail traders, navigating the dynamic waters of the stock market can be both exhilarating and daunting. While the allure of quick gains is strong, sustainable success hinges on a robust understanding of market dynamics and effective analytical tools. Among these, candlestick patterns stand out as a fundamental, visually intuitive method for interpreting price action. Originating centuries ago in Japan, these graphical representations of price movements offer invaluable insights into market sentiment, potential trend reversals, and continuations. They are, in essence, the market’s language, providing clues that can inform critical trading decisions. In the increasingly sophisticated Indian market, where real-time pattern scanners are now common on NSE-linked instruments and stocks, a firm grasp of these patterns is no longer optional but essential. This article will delve into the most crucial candlestick patterns every Indian retail trader should be familiar with, emphasizing how to integrate them effectively into a comprehensive trading strategy, always remembering that patterns alone are not sufficient without broader technical analysis, backtesting, and robust risk management.
For those looking to deepen their understanding of trading strategies, the article “Candlestick Patterns Every Indian Retail Trader Should Know” is an excellent resource. Additionally, you may find valuable insights in the related article on daily market trends and analysis, which can enhance your trading decisions. You can read it here: Daily Market Overview.
The Foundation of Candlestick Analysis: Decoding the Basics

Before diving into specific patterns, it’s vital to understand the building blocks of a candlestick. Each candle encapsulates four key pieces of price information over a specified timeframe: the opening price, the closing price, the highest price, and the lowest price. This visual encapsulation allows traders to quickly ascertain the prevailing sentiment during that period.
The Anatomy of a Candlestick
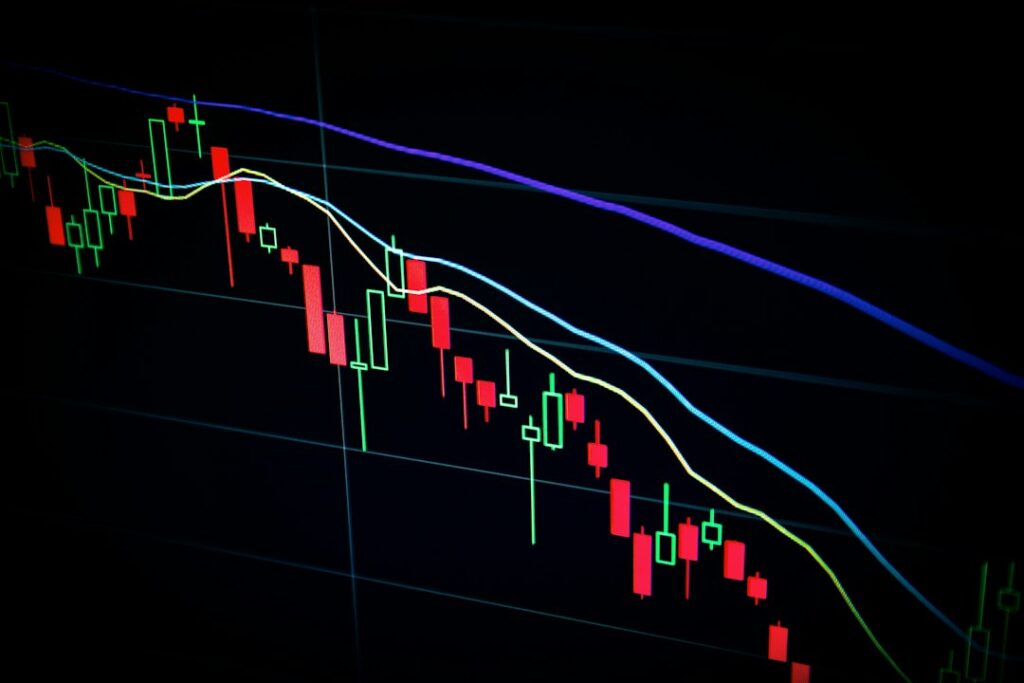
A typical candlestick consists of a “body” and “wicks” (also known as shadows or tails). The body represents the range between the opening and closing prices. If the closing price is higher than the opening price, the body is typically green (or white), indicating a bullish candle. Conversely, if the closing price is lower than the opening price, the body is usually red (or black), signifying a bearish candle. The wicks extend from the top and bottom of the body, indicating the highest and lowest prices reached during that period. The upper wick shows the highest price, and the lower wick shows the lowest price. The length of the body and wicks provides clues about the strength of buying or selling pressure and the volatility within that timeframe. For instance, a long green body with short wicks suggests strong buying pressure with minimal retraction, while a long red body indicates significant selling pressure. Understanding this fundamental structure is the first step towards deciphering the market’s narrative as told by candlesticks.
The Importance of Timeframes and Context
While candlestick patterns offer powerful visual cues, their significance heavily depends on the timeframe being analyzed and the broader market context. A Bullish Engulfing pattern on a 5-minute chart might signal a short-term bounce, but the same pattern on a daily chart could indicate a more significant reversal. Indian retail traders must choose timeframes that align with their trading style – short-term traders might focus on hourly or daily charts, while positional traders might look at weekly charts. More importantly, recent market tools are increasingly emphasizing context-based pattern analysis rather than just pattern names. This means adding filters such as trend direction, volume, support/resistance, and RSI to improve signal quality. A Bullish Hammer, for example, holds far greater weight if it appears at a major support level after a prolonged downtrend, especially if accompanied by higher-than-average volume. Ignoring context can lead to false signals and costly mistakes. Always ask: What is the prevailing trend? Is this pattern appearing at a significant price level? What do other indicators suggest? This holistic approach is crucial for effective decision-making.
Key Candlestick Reversal Patterns for Indian Retail Traders
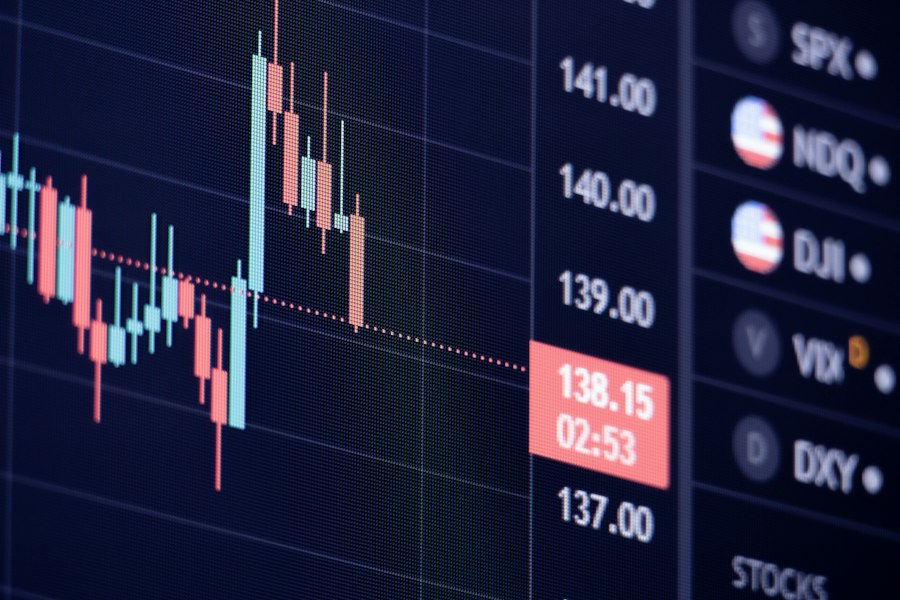
Reversal patterns are among the most sought-after signals by traders, as they indicate a potential shift in the prevailing trend. Spotting these patterns early can offer excellent opportunities for entering or exiting trades strategically. Several core patterns remain highly useful for Indian retail traders, consistently highlighted in trading guides.
Bullish Reversal Patterns
These patterns suggest that a downtrend may be coming to an end and that an upward movement is likely to begin. Recognizing these can help traders identify potential buying opportunities.
Hammer
The Hammer is a bullish reversal pattern that typically appears at the bottom of a downtrend. It features a small body (green or red) near the top of the price range, with a long lower wick that is at least twice the length of the body, and a very short or no upper wick. The long lower wick indicates that sellers pushed prices down significantly, but buyers stepped in forcefully to push prices back up, closing near the open. This shows strong buying pressure overcoming selling pressure. The appearance of a Bullish Hammer on NSE-linked instruments and stocks is a common signal seen on real-time scanners, and when found at a support level, it becomes an even more potent signal for a potential reversal.
Morning Star / Morning Doji Star
The Morning Star is a three-candlestick bullish reversal pattern. It typically forms after a downtrend and signals a potential shift to an uptrend. The first candle is a long bearish (red) candle, indicating strong selling pressure. The second candle is a small-bodied candle (can be a Doji, forming a Morning Doji Star, or a small green/red candle) that gaps down, showing indecision or a weakening of selling pressure. The third candle is a long bullish (green) candle that closes well into the body of the first candle, indicating that buyers have taken control. The Morning Doji Star, specifically, enhances the reversal signal due to the Doji’s strong indication of indecision. This pattern, particularly the Morning Doji Star, is frequently highlighted by real-time pattern scanners as a significant bullish setup.
Bullish Engulfing
The Bullish Engulfing pattern is a strong two-candlestick bullish reversal pattern. It occurs when a large bullish (green) candle completely engulfs the body of the preceding smaller bearish (red) candle. This indicates that buyers have completely overwhelmed sellers, pushing prices significantly higher than the previous session’s range. It suggests a powerful shift in sentiment from bearish to bullish. The Bullish Engulfing pattern is one of the most recognized and actively scanned patterns on Indian stock and index pages, serving as a clear signal of potential bullish reversal setups on daily charts. Its presence implies strong buying momentum entering the market.
Piercing Pattern
Similar to the Bullish Engulfing, the Piercing Pattern is a two-candlestick bullish reversal pattern. It also appears after a downtrend. The first candle is a long bearish (red) candle. The second candle is a strong bullish (green) candle that opens below the low of the first candle but closes more than halfway into the body of the first candle, ideally above its midpoint. This indicates that buyers have started to regain control and are pushing prices higher, piercing through the previous day’s bearish sentiment. While not as strong as a full engulfing, it still signifies a significant shift in buyer confidence.
Bullish Harami / Harami Cross
The Bullish Harami (meaning “pregnant” in Japanese) is a two-candlestick bullish reversal pattern. It appears after a downtrend. The first candle is a long bearish (red) candle, followed by a smaller bullish (green) candle whose entire body is contained within the body of the first candle. This suggests that the strong selling pressure from the first day has diminished, and buying pressure is starting to emerge, albeit cautiously. The Harami Cross variant occurs when the second candle is a Doji, indicating even greater indecision and a strong likelihood of a trend reversal. Both Harami and Harami Cross are frequently seen on pattern scanners for NSE-linked instruments, signaling potential turning points.
Bearish Reversal Patterns
Conversely, bearish reversal patterns suggest that an uptrend might be losing steam, and a downward movement could be imminent. These patterns can help traders identify opportune moments to take profits or initiate short positions.
Shooting Star
The Shooting Star is a bearish reversal pattern that typically appears at the top of an uptrend. It is the bearish counterpart of the Hammer. It features a small body (green or red) near the bottom of the price range, with a long upper wick that is at least twice the length of the body, and a very short or no lower wick. The long upper wick indicates that buyers attempted to push prices higher, but sellers forcefully stepped in to push prices back down, closing near the open or even lower. This signals strong selling pressure overcoming buying pressure. When seen at a resistance level, it becomes a strong indicator of potential trend reversal.
Evening Star / Evening Doji Star
The Evening Star is a three-candlestick bearish reversal pattern, the inverse of the Morning Star. It typically forms after an uptrend and signals a potential shift to a downtrend. The first candle is a long bullish (green) candle, indicating strong buying pressure. The second candle is a small-bodied candle (can be a Doji, forming an Evening Doji Star, or a small green/red candle) that gaps up, showing indecision or a weakening of buying pressure. The third candle is a long bearish (red) candle that closes well into the body of the first candle, indicating that sellers have taken control. The Evening Doji Star further strengthens the reversal signal due to the Doji’s strong indication of indecision.
Bearish Engulfing
The Bearish Engulfing pattern is a strong two-candlestick bearish reversal pattern, the inverse of the Bullish Engulfing. It occurs when a large bearish (red) candle completely engulfs the body of the preceding smaller bullish (green) candle. This indicates that sellers have completely overwhelmed buyers, pushing prices significantly lower than the previous session’s range. It suggests a powerful shift in sentiment from bullish to bearish, often appearing at the top of an uptrend.
Dark Cloud Cover
The Dark Cloud Cover is a two-candlestick bearish reversal pattern, the inverse of the Piercing Pattern. It appears after an uptrend. The first candle is a long bullish (green) candle. The second candle is a strong bearish (red) candle that opens above the high of the first candle but closes more than halfway into the body of the first candle, ideally below its midpoint. This indicates that sellers have started to regain control and are pushing prices lower, covering the previous day’s bullish sentiment with a “dark cloud.”
Bearish Harami / Harami Cross
The Bearish Harami is a two-candlestick bearish reversal pattern, the inverse of the Bullish Harami. It appears after an uptrend. The first candle is a long bullish (green) candle, followed by a smaller bearish (red) candle whose entire body is contained within the body of the first candle. This suggests that the strong buying pressure from the first day has diminished, and selling pressure is starting to emerge, albeit cautiously. The Harami Cross variant occurs when the second candle is a Doji, indicating even greater indecision and a strong likelihood of a trend reversal.
Candlestick Continuation and Indecision Patterns
While reversal patterns signal a potential change in trend, continuation patterns suggest that the existing trend is likely to persist after a brief pause. Indecision patterns, on the other hand, highlight a struggle between buyers and sellers, often preceding a significant move.
Doji: The Epitome of Indecision
The Doji is arguably one of the most important and frequently cited candlestick patterns. It forms when the opening and closing prices are very close or exactly the same, creating a very small or almost non-existent body. The length of the wicks can vary. A Doji signifies market indecision, where neither buyers nor sellers are able to gain significant control. It indicates a pause in the market’s current direction. While a Doji itself doesn’t indicate reversal or continuation, its appearance after a strong trend (either up or down) can be a strong warning sign of potential trend exhaustion and an impending reversal. When a Doji forms during consolidation within a trend, it might suggest a temporary pause before the trend resumes. Real-time pattern scanners frequently highlight Doji patterns, making them a crucial pattern for Indian retail traders to monitor. Context is paramount with Dojis: a Doji after a long bullish run at resistance, or after a significant bearish run at support, holds much more weight than one appearing in a choppy, sideways market.
Marubozu: Strong Directional Momentum
The Marubozu (meaning “bald head” or “shaved head” in Japanese) is a powerful single-candlestick pattern characterized by a body with little to no wicks. This indicates that the opening and closing prices are at or very near the high and low for the period, signifying strong, uninterrupted buying or selling pressure.
White Marubozu
A White Marubozu is a long green candle with no upper or lower wicks. It means the opening price was the lowest price, and the closing price was the highest price for the session. This pattern indicates extremely strong buying pressure throughout the period, from open to close. The recent appearance of White Marubozu on multiple Nifty500 stocks in a bullish scanner is a prime example of its significance, signaling robust buying momentum within the session. It suggests that buyers were in control from the moment trading began until it ended, often preceding further upward movement.
Black Marubozu
A Black Marubozu is a long red candle with no upper or lower wicks. It means the opening price was the highest price, and the closing price was the lowest price for the session. This pattern indicates extremely strong selling pressure throughout the period, from open to close. It suggests that sellers were in complete control, pushing prices down relentlessly. A Black Marubozu often precedes further downward movement.
Spinning Top: Temporary Indecision
A Spinning Top is similar to a Doji in that it has a small body, indicating indecision. However, unlike a Doji, its open and close are not as close to each other, resulting in a slightly more visible body. It also typically has long upper and lower wicks, signifying that both buyers and sellers were active but neither could gain a decisive advantage. Like a Doji, a Spinning Top itself is neutral. Its significance comes from its context. After a strong uptrend or downtrend, a Spinning Top can signal a weakening of the trend and potential reversal. Within a strong trend, it might indicate a temporary pause before the trend resumes.
For those looking to deepen their understanding of trading strategies, a related article that provides valuable insights is available at Daily Market Overview and Trading Insights. This resource complements the knowledge gained from learning about candlestick patterns, offering a broader perspective on market trends and trading tactics that can benefit Indian retail traders. By exploring both articles, traders can enhance their skills and make more informed decisions in the dynamic world of trading.
Integrating Candlestick Patterns into a Trading Strategy
| Candlestick Pattern | Description | Indication | Common Usage |
|---|---|---|---|
| Doji | Opening and closing prices are almost the same, forming a cross or plus sign. | Market indecision; potential reversal signal. | Used to identify possible trend reversals or pauses. |
| Hammer | Small body with a long lower wick, appearing after a downtrend. | Potential bullish reversal. | Signals buying opportunity after a decline. |
| Shooting Star | Small body with a long upper wick, appearing after an uptrend. | Potential bearish reversal. | Indicates selling pressure after a rise. |
| Bullish Engulfing | A small bearish candle followed by a larger bullish candle that engulfs it. | Strong bullish reversal. | Used to confirm trend reversal to upside. |
| Bearish Engulfing | A small bullish candle followed by a larger bearish candle that engulfs it. | Strong bearish reversal. | Signals potential trend reversal to downside. |
| Morning Star | Three-candle pattern signaling bullish reversal: large bearish, small indecision candle, large bullish. | Bullish trend reversal. | Used to identify bottoming out in downtrend. |
| Evening Star | Three-candle pattern signaling bearish reversal: large bullish, small indecision candle, large bearish. | Bearish trend reversal. | Used to identify topping out in uptrend. |
| Marubozu | Candle with no wicks; strong buying or selling pressure. | Strong continuation signal. | Confirms momentum in the direction of the candle. |
Merely identifying candlestick patterns is insufficient for profitable trading. The true skill lies in integrating these visual cues into a broader, well-defined trading strategy that includes other technical indicators, risk management, and rigorous backtesting. Indian finance articles increasingly warn that candlestick patterns alone are not reliable enough and should be paired with a comprehensive approach.
Confirmation and Confluence with Other Indicators
The reliability of a candlestick pattern significantly increases when confirmed by other technical analysis tools. This concept is known as “confluence.” For instance, a Bullish Engulfing pattern occurring at a strong support level, coupled with increasing volume and a bullish divergence on the Relative Strength Index (RSI), presents a far stronger buy signal than the pattern alone. Similarly, a Shooting Star appearing at a resistance level, confirmed by declining volume and an overbought reading on the Stochastic Oscillator, makes for a more compelling sell signal. Traders should look to combine candlestick patterns with indicators such as:
- Support and Resistance Levels: Patterns at these critical price zones are often more reliable.
- Volume: High volume accompanying a reversal pattern lends more credibility to the signal.
- Moving Averages: Crossovers or price action relative to moving averages can confirm trend direction.
- Oscillators (RSI, Stochastic, MACD): These can indicate overbought/oversold conditions or momentum shifts, providing further confirmation for reversal patterns.
Market tools are increasingly incorporating these filters, allowing traders to perform context-based pattern analysis, thereby enhancing signal quality. This multi-factor approach significantly reduces false signals and improves the probability of successful trades.
Risk Management and Position Sizing
Even the most robust candlestick pattern, confirmed by multiple indicators, does not guarantee success. The market is inherently unpredictable, and losses are an inevitable part of trading. Therefore, effective risk management and appropriate position sizing are paramount. For every trade, Indian retail traders must define their maximum tolerable loss and set a stop-loss order accordingly. A common rule of thumb is to risk no more than 1-2% of the total trading capital on any single trade. Position sizing should be adjusted based on the distance to the stop-loss and the overall risk appetite. For instance, if a Bullish Hammer provides an entry signal, the stop-loss might be placed just below the low of the Hammer’s lower wick. The position size would then be calculated to ensure that if the stop-loss is hit, the capital risked is within the predetermined limits. This disciplined approach protects capital and ensures longevity in the market, allowing traders to survive losing streaks and capitalize on winning ones.
Backtesting and Continuous Learning
The Indian stock market is constantly evolving, and what worked yesterday might not work tomorrow. Therefore, backtesting candlestick patterns and trading strategies is crucial. Backtesting involves applying a trading strategy to historical data to see how it would have performed. This helps traders understand the profitability, win rate, and drawdowns of their chosen patterns in specific market conditions. Many trading platforms and software offer backtesting capabilities. Furthermore, continuous learning is non-negotiable. Staying updated with market news, economic developments, and new analytical techniques is vital. Attending webinars, reading financial literature, and joining trading communities can provide valuable insights. The collective experience of the market highlights that the most useful patterns for retail traders are still the core ones: Doji, Hammer, Shooting Star, Engulfing, Morning Star, Evening Star, and Harami. However, their application and interpretation must evolve with market tools and context-based analysis. By consistently refining their understanding and approach, Indian retail traders can enhance their ability to interpret candlestick patterns and make more informed trading decisions, navigating the complexities of the market with greater confidence.
FAQs
What are candlestick patterns?
Candlestick patterns are graphical representations of price movements in financial markets over a specific time period. Each candlestick shows the open, high, low, and close prices for that period, allowing traders to analyze market sentiment and potential future price movements.
Why are candlestick patterns important for Indian retail traders?
Candlestick patterns are crucial for Indian retail traders as they provide visual cues about market trends and reversals. Understanding these patterns can help traders make informed decisions, manage risks, and identify potential entry and exit points in their trading strategies.
What are some common candlestick patterns that traders should know?
Some common candlestick patterns include the Doji, Hammer, Engulfing, Shooting Star, and Morning Star. Each pattern has its own significance and can indicate potential market reversals or continuations, making them essential for traders to recognize.
How can traders use candlestick patterns in their trading strategies?
Traders can use candlestick patterns in their strategies by combining them with other technical indicators and analysis methods. For example, they may look for confirmation from volume trends or moving averages to validate the signals provided by candlestick patterns before making trading decisions.
Are candlestick patterns reliable indicators of market movements?
While candlestick patterns can provide valuable insights into market sentiment and potential price movements, they are not foolproof. Traders should use them in conjunction with other analysis tools and risk management strategies to enhance their trading effectiveness and minimize losses.

