
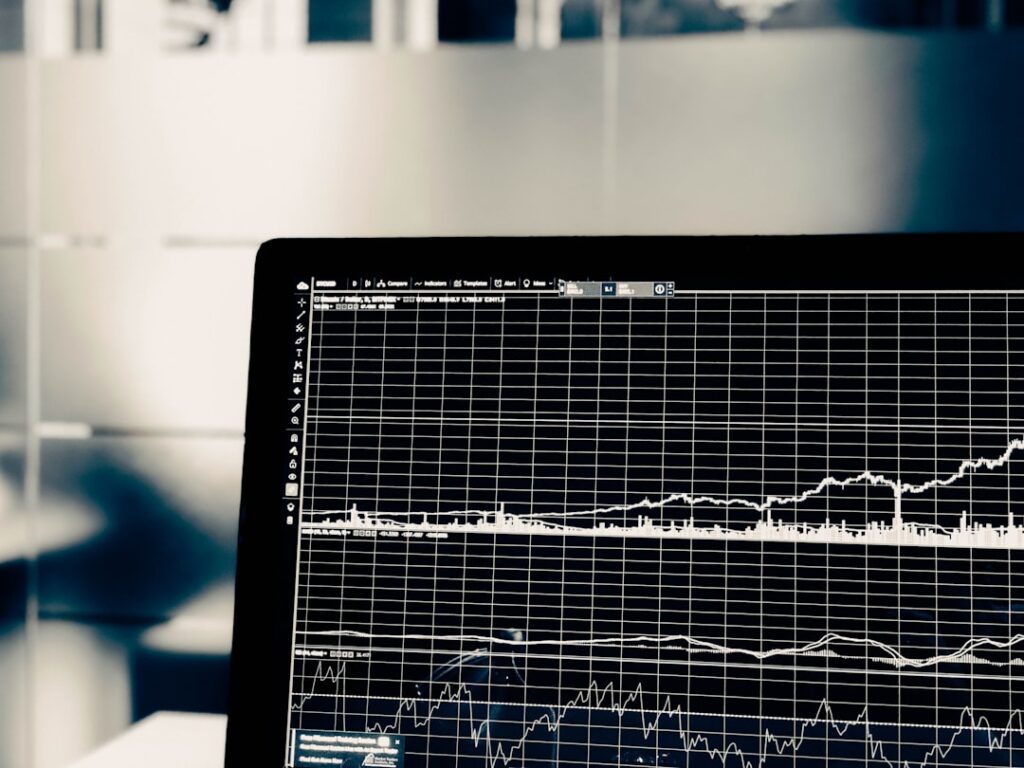
Welcome, aspiring Indian stock market traders! In the dynamic world of financial markets, having the right tools can make all the difference between informed decisions and guesswork. And when it comes to powerful, yet accessible charting platforms, TradingView stands head and shoulders above the rest. As a seasoned market analyst and blogger, I’ve seen countless platforms come and go, but TradingView has consistently proven itself to be an invaluable asset for traders of all levels, especially those navigating the intricacies of the Indian stock market.
This comprehensive guide is designed to be your stepping stone into the world of TradingView, specifically tailored to the needs of Indian traders. We’ll explore its core functionalities, reveal how to leverage its features for Nifty, Bank Nifty, and individual stock analysis, and equip you with the knowledge to start your journey with confidence.
Embarking on your TradingView journey is surprisingly straightforward. Think of it as setting up your virtual trading workstation – a personalized hub for market insights.
Creating Your TradingView Account
The very first step is to create an account. TradingView offers various subscription tiers, including a robust free plan that is more than sufficient for most beginners.
- Free vs. Paid Plans: While the free plan provides access to most essential charting tools, indicators, and data for major Indian exchanges, paid plans offer additional features like more indicators per chart, multiple chart layouts, enhanced data depth, and an ad-free experience. For starters, the free plan is excellent for exploration.
- Sign-up Process: Head over to the TradingView website and click on “Sign Up.” You can register using your email, Google, Facebook, or other social media accounts. The process is quick and intuitive.
Navigating the Interface: Your Trading Dashboard
Once logged in, you’ll be greeted by the default TradingView interface. It might seem a bit overwhelming at first, but let’s break it down into manageable sections.
- The Main Chart Area: This is where the magic happens. Your chosen stock or index chart will be displayed here, showcasing price movements over time. You can zoom in/out, change timeframes, and apply various drawing tools.
- Symbol Search Bar: Located at the top of the screen (or sometimes top-left), this is your gateway to finding any stock, index, commodity, or currency pair. For Indian markets, you’ll typically type the symbol followed by the exchange code (e.g., “RELIANCE.NSE” for Reliance Industries on NSE, or “NIFTY.NSE” for Nifty 50).
- Toolbar (Left Side): This vertical bar on the left contains all your drawing tools – trend lines, horizontal lines, Fibonacci retracements, geometric shapes, text boxes, and more. Mastering these is crucial for technical analysis.
- Indicators & Strategies (Top Bar): This button (often labeled “Indicators” or an ‘fx’ icon) is where you’ll find an extensive library of technical indicators like Moving Averages, RSI, MACD, Bollinger Bands, etc. We’ll delve deeper into these later.
- Timeframe Selector (Top Bar): Easily switch between different timeframes for your chart – from seconds and minutes for intraday trading to daily, weekly, and monthly for positional and long-term analysis.
- Watchlist (Right Side Panel): This customizable panel allows you to create lists of your favorite stocks and indices, keeping a close eye on their performance without having to constantly search for them. We’ll show you how to set this up effectively.
- Alerts Panel (Right Side Panel): A powerful feature that allows you to set price alerts for specific levels, notifying you via email or push notification when your conditions are met. Essential for busy traders.
- News & Data Panels (Bottom/Right): These panels provide real-time news, economic calendars, and data related to the asset you’re currently viewing.
Charting Essentials: Understanding the Visual Language of Markets
Charts are the language of the market, and TradingView is your interpreter. Learning to read and manipulate charts is fundamental to any successful trading strategy.
Candlestick Charts: The Trader’s Best Friend
While TradingView offers various chart types (bar, line, Heikin Ashi, etc.), candlestick charts are the most popular among professional traders for their rich visual information.
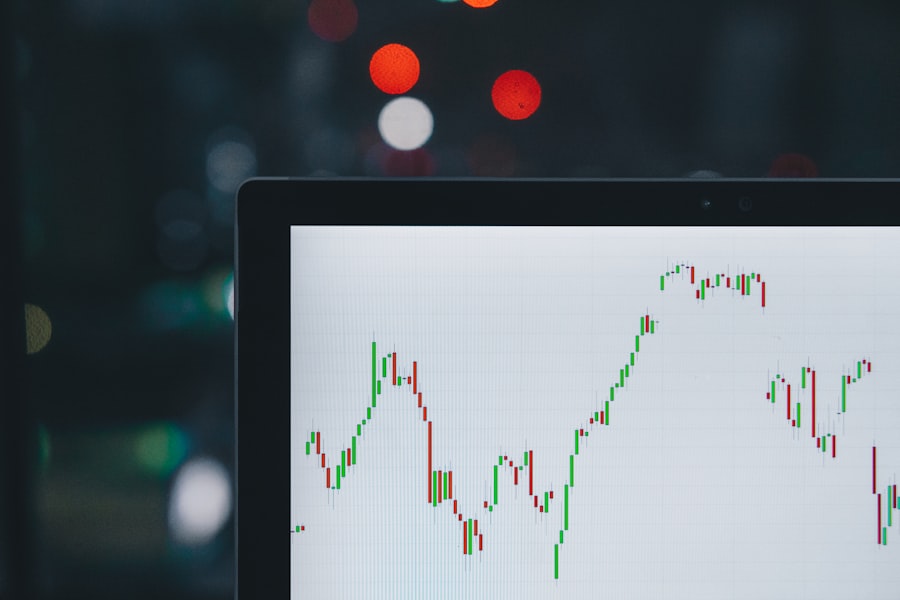
- Understanding Candlestick Components: Each candlestick represents price action over a specific timeframe (e.g., 1 day, 1 hour). It shows the opening price, closing price, highest price, and lowest price within that period.
- Body: The main rectangular part of the candlestick, representing the open and close prices.
- Wicks/Shadows: The thin lines extending above and below the body, indicating the highest and lowest prices reached.
- Color: Typically, green (or white) signifies a bullish candle (close > open), while red (or black) signifies a bearish candle (close < open).
- Interpreting Candlestick Patterns: Candlesticks form various patterns (e.g., Doji, Hammer, Engulfing) that can provide insights into market sentiment and potential price reversals or continuations. TradingView’s extensive library of educational resources can help you learn these patterns.
Customizing Your Chart Layout: Personalizing Your Workspace
TradingView allows for extensive customization, ensuring your chart environment is optimized for your trading style.
- Changing Chart Type & Timeframe: Easily switch between chart types (candlestick, bar, line) and timeframes using the top bar selectors. Experiment to see what works best for your analysis.
- Adjusting Colors & Appearance: Right-click on the chart and select “Settings” to customize virtually every visual aspect – candle colors, background, grid lines, text size, etc. A clean, uncluttered chart improves focus.
- Saving Chart Layouts: If you have a specific setup (e.g., a multi-chart layout with particular indicators), you can save it as a “Layout” to quickly reload it later. This is incredibly useful for different analysis tasks (e.g., one layout for intraday, another for positional).
Drawing Tools: Unleashing Your Technical Analysis Prowess
The left-hand toolbar is packed with essential drawing tools that are the backbone of technical analysis.
- Trend Lines: Identify and draw support and resistance levels, trend channels, and diagnose the prevailing market direction.
- Horizontal Lines: Mark significant price levels (e.g., previous highs/lows, breakout points) that act as potential support or resistance.
- Fibonacci Retracement: A popular tool for identifying potential reversal levels based on the Fibonacci sequence. Indian traders often use this for predicting pullbacks and extensions.
- Geometric Shapes (Rectangles, Ellipses): Highlight areas of consolidation, strong support/resistance zones, or chart patterns.
- Text & Callouts: Add notes directly to your chart to document your analysis, trade ideas, or observations.
Essential Indicators for Indian Stock Market Traders
Technical indicators are mathematical calculations based on price and volume data. They help traders gain further insights into market conditions, identify trends, and spot potential entry/exit points. TradingView boasts an unparalleled library of indicators, both built-in and community-created.
Trend-Following Indicators: Riding the Wave
These indicators help identify and confirm the direction of a trend.
- Moving Averages (MA/EMA): Perhaps the most fundamental indicator. Simple Moving Averages (SMA) and Exponential Moving Averages (EMA) smooth out price data to show the average price over a period.
- Strategy Idea: Crossovers of different moving averages (e.g., 50-period EMA crossing above 200-period EMA) can signal potential trend changes. Indian traders often use 9, 20, 50, 100, and 200-period MAs.
- Bollinger Bands: These bands consist of a central moving average and two outer bands (typically two standard deviations away). They measure market volatility and can signal overbought/oversold conditions.
- Strategy Idea: Price touching the upper band might indicate overbought, while touching the lower band might indicate oversold. A squeeze in the bands often precedes a significant price move.
Oscillators: Measuring Momentum and Overbought/Oversold Conditions
Oscillators fluctuate within a defined range and are excellent for identifying turning points.
- Relative Strength Index (RSI): A momentum oscillator that measures the speed and change of price movements. It ranges from 0 to 100.
- Strategy Idea: Readings above 70 are typically considered overbought, and below 30, oversold. Divergences between RSI and price can signal potential reversals.
- Moving Average Convergence Divergence (MACD): A trend-following momentum indicator that shows the relationship between two moving averages of a security’s price.
- Strategy Idea: A bullish crossover occurs when the MACD line crosses above the signal line, indicating upward momentum. A bearish crossover suggests downward momentum.
- Stochastic Oscillator: Similar to RSI, this momentum indicator compares a specific closing price of a security to a range of its prices over a certain period.
- Strategy Idea: Readings above 80 are overbought, below 20 are oversold. Crossovers between the %K and %D lines can also provide trading signals.
Volume Indicators: Confirming Price Action
Volume is often overlooked but provides crucial confirmation for price movements.
- Volume: The most straightforward volume indicator shows the number of shares traded over a specific period.
- Strategy Idea: A strong price move accompanied by high volume is generally more reliable than a similar move on low volume. Declining volume during a trend might signal weakening momentum.
- On-Balance Volume (OBV): A cumulative momentum indicator that relates volume to price change.
- Strategy Idea: OBV rising with price confirms the trend. If price rises but OBV declines, it could signal a weak rally.
Advanced TradingView Features for Indian Traders
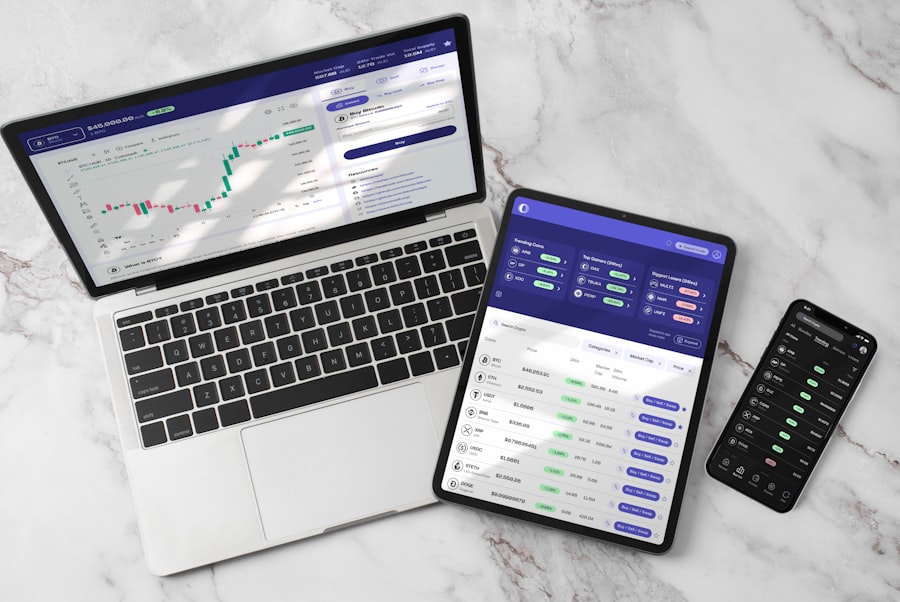
Once you’re comfortable with the basics, TradingView offers a plethora of advanced features that can significantly enhance your analysis and trading strategy.
Watchlists and Alerts: Keeping Tabs on Your Favorites
Efficiently monitoring a portfolio of stocks is key, and TradingView’s watchlist and alert features are indispensable.
- Building Custom Watchlists: Create multiple watchlists for different sectors, themes, or trading strategies (e.g., “Nifty 50 Stocks,” “Midcap Breakouts,” “F&O Stocks”). Simply click the ‘+’ icon on the watchlist panel and add symbols.
- Setting Price Alerts: This is a game-changer. Set alerts for specific price levels, indicator crossovers, or pattern breaks.
- Example for Nifty: “NIFTY.NSE crosses 22500” or “RELIANCE.NSE crosses above 200 EMA.”
- Alert Types: Get notified via email, push notifications to your mobile app, or even an audible sound on your desktop. This frees you from constantly staring at the screen.
Screener: Finding Opportunities in the Indian Market
The stock screener is one of TradingView’s most powerful tools, allowing you to filter thousands of stocks based on various technical and fundamental criteria.
- Accessing the Screener: Go to “Products” -> “Screeners” -> “Stock Screener” on the TradingView website, or find it in the bottom panel of your chart.
- Filtering for Indian Stocks: Ensure you select “India” as your country filter.
- Applying Technical Filters: Filter by market capitalization, industry, volume, RSI levels, moving average crossovers, candlestick patterns, and more.
- Example: Find all NSE stocks with a market cap > ₹10,000 Cr, where RSI(14) is below 30 (potentially oversold), and current price is above its 200-day EMA (long-term uptrend).
- Applying Fundamental Filters (Limited in Free Plan): While the free plan has limitations, paid plans offer more extensive fundamental filters, which can be useful for long-term investors.
Pine Script: Customizing and Automating Your Analysis
For the more technically inclined, Pine Script is TradingView’s proprietary programming language, allowing you to create custom indicators and strategies.
- Understanding Pine Script Basics: Even if you’re not a programmer, understanding the concept is valuable. Pine Script allows you to:
- Create Custom Indicators: Develop unique indicators tailored to your specific trading logic.
- Backtest Strategies: Test your trading strategies on historical data to evaluate their performance.
- Automate Alerts: Set up highly specific alerts based on complex conditions that go beyond standard indicator settings.
- Community Scripts: Don’t want to code? The TradingView community has an enormous library of publicly shared Pine Script indicators and strategies that you can explore and use for free. Simply go to the “Indicators” menu and search for “Public Library.”
Integrating TradingView into Your Indian Trading Workflow
| Chapter | Topic | Metrics |
|---|---|---|
| 1 | Introduction to TradingView | Page views: 1500, Time spent: 3 minutes |
| 2 | Setting up TradingView for Indian Stock Market | Page views: 1200, Time spent: 2.5 minutes |
| 3 | Using Technical Indicators | Page views: 1800, Time spent: 3.5 minutes |
| 4 | Creating Watchlists and Alerts | Page views: 1400, Time spent: 3 minutes |
| 5 | Executing Trades on TradingView | Page views: 1600, Time spent: 3 minutes |
TradingView isn’t just a charting platform; it’s a comprehensive ecosystem that can seamlessly integrate into your daily trading routine for the Indian markets.
Connecting with Indian Brokers
While TradingView offers direct brokerage integration, currently, direct trading from TradingView for Indian brokers is somewhat limited or in development for many. However, you can still leverage TradingView for analysis and then execute trades on your preferred Indian brokerage platform.
- Analysis on TradingView, Execution on Broker Terminal: This is the most common workflow. Perform all your technical analysis, identify entry/exit points, and set alerts on TradingView. When an alert triggers or you spot an opportunity, switch to your broker’s trading platform (e.g., Zerodha, Upstox, Groww, ICICI Direct) to place your orders.
- Future Integrations: Keep an eye on TradingView announcements, as they are continuously expanding their brokerage integrations.
Using TradingView for Different Trading Styles
Whether you’re an intraday trader, swing trader, or long-term investor, TradingView caters to all.
- Intraday Trading:
- Timeframes: Use lower timeframes like 1-minute, 5-minute, 15-minute charts for quick decisions.
- Indicators: Fast-moving averages, RSI, MACD, Volume Profile, VWAP (Volume Weighted Average Price) are popular.
- Drawing Tools: Quick trend lines, support/resistance levels.
- Watchlists: Keep a tight watchlist of liquid Nifty/Bank Nifty stocks and F&O instruments.
- Swing Trading:
- Timeframes: 1-hour, 4-hour, daily charts for capturing medium-term price swings.
- Indicators: Longer-period moving averages, Bollinger Bands, RSI, MACD for trend and momentum.
- Drawing Tools: Fibonacci retracements, trend channels for identifying turning points.
- Screener: Use the screener to find stocks breaking out of consolidation or showing strength/weakness on daily charts.
- Long-Term Investing:
- Timeframes: Weekly, monthly charts for macro analysis and identifying long-term trends.
- Indicators: Very long-period moving averages (e.g., 200-period weekly MA), fundamental data (available in paid plans or via external research).
- Screener: Filter for fundamentally strong companies with consistent growth and healthy financials.
Community & Education: Learning from the Best
TradingView isn’t just a platform; it’s a vibrant global community of traders and investors.
- Idea Stream: Explore trading ideas published by other users, covering various markets including Indian stocks. It’s a great way to discover new perspectives and strategies, but always perform your own due diligence.
- Educational Articles & Tutorials: TradingView offers a wealth of educational content, helping you understand technical analysis concepts, indicators, and chart patterns.
- User Forums: Engage with other traders, ask questions, and share your insights. This collaborative environment can be incredibly beneficial for learning and growth.
By mastering TradingView, you’re not just learning to use a tool; you’re unlocking a powerful framework for understanding and navigating the Indian stock market. Start with the basics, practice consistently, and gradually explore its advanced features. Happy trading!

