

The way you interpret market structure changes everything in trading. Whether you trade indices on NSE and BSE, hunt intraday moves in Nifty, or manage swing positions, a simple framework based on money flow, color-coded zones, and angle-breakout logic helps you spot high-probability trades and avoid false momentum. Below I explain a practical approach that blends algorithmic signals with human context, shows how news and macro events alter flows, and explains why December often feels quieter for the market.
Table of Contents
- 🔍 The core idea: money flow, zones, and angle breakouts
- 📉 Spotting false breakouts and momentum traps
- ⚙️ How algorithmic logic helps: small traders vs larger flow
- 📈 Trade management: capturing moves and booking profit
- 📰 Market-moving news: when macro overrides the setup
- 🛢️ Commodities, crude, and global context
- 🥇 Gold and mean reversion
- 📆 Seasonality and why December feels slow
- 🧭 Practical checklist before taking a trade
- 🛡️ Risk management and trader psychology
- 🚀 Where algorithmic systems add the most value
- ❓ Frequently Asked Questions
- 🔗 Final thoughts and preparation for next steps
🔍 The core idea: money flow, zones, and angle breakouts
At the heart of reliable setups is one observation: algorithms can flag structural shifts before big players fully commit. Use three simple lenses when you look at a chart:
- Money flow line — A smoothed measure of where capital is moving. When the line shifts color or direction, it signals a change in willingness to buy or sell.
- Zone coloring (red / green) — Zones represent consolidation or bias. A red zone is a supply-dominant area; a green zone is demand-dominant. Candles moving against zone color are suspect until confirmed by momentum.
- Angle formation and breakout — Angles are short structural patterns. A breakout without candle confirmation or momentum is likely to fail. Wait for angle formation plus momentum to commit.
Combine these three to filter setups: if money flow turns red, zone is red, and an angle breakout happens downward with momentum, the probability of a sustained downtrend increases. Conversely, green zone, positive money flow, and an upward angle breakout with follow-through creates a reliable bullish signal.
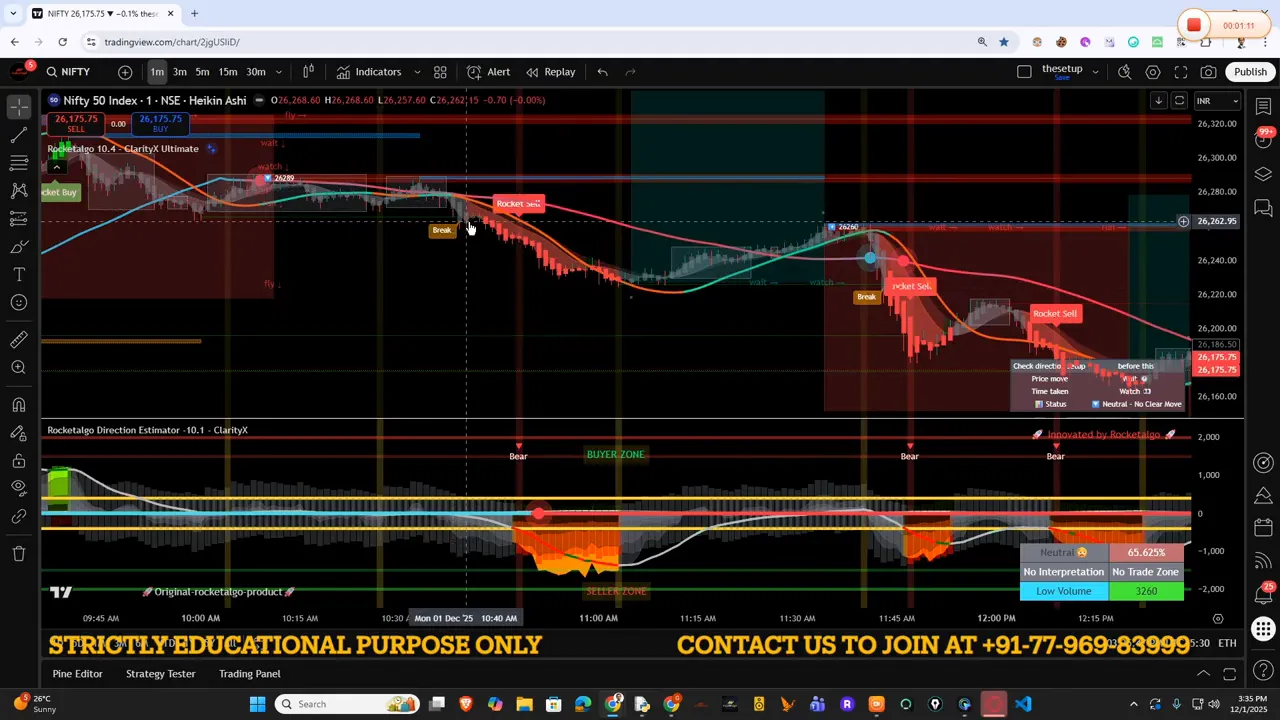
📉 Spotting false breakouts and momentum traps
One of the most common traps is seeing green candles inside a red zone and assuming the market will move up. That rarely makes sense. When candles move against the zone color, ask these questions:
- Is money flow supporting this move?
- Has an angle formed and then broken out with volume and momentum?
- Are larger players showing readiness to add capital, or is this just intraday chop?
If answer to the first two is no, treat that move as a potential trap. For example, a breakout after an angle that lacks candle confirmation or momentum typically stalls. The setup shows up as a red zone with green candles — a classic sign that short-term buys are being absorbed and a stronger move down often follows.
⚙️ How algorithmic logic helps: small traders vs larger flow
Algorithms can index behavior and present it as an easy read: small retail traders often prepare to enter at obvious levels. When many retail traders show readiness, the money flow line starts reflecting that crowd behavior.
Important takeaway: algorithms aren’t a black box predicting the future. They map the current readiness of market participants. When you see the money flow line turn red and the zone also go red, it signals that smaller participants have positioned themselves and larger market forces can push the price away from their expected direction.
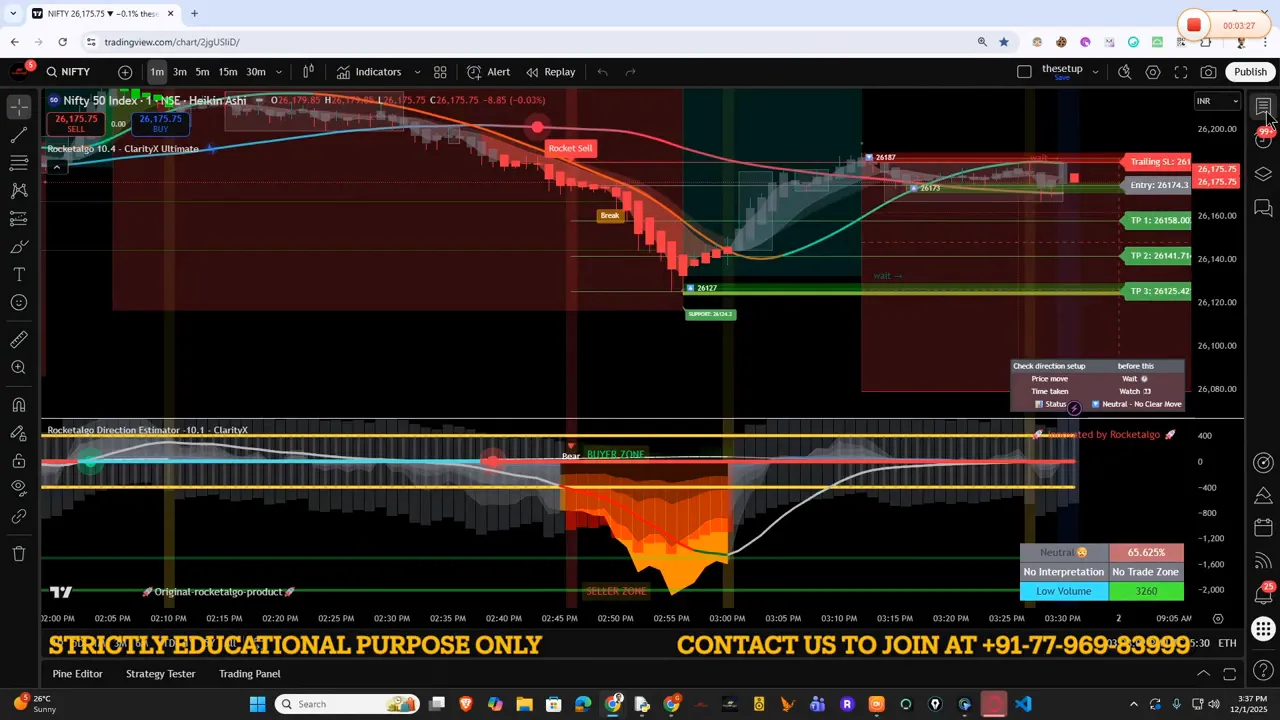
Because the algorithm aggregates minute signals, you see setups where three targets are hit in sequence — the system captures momentum and projects probable targets. That is the value of combining zone color, money flow, and angle breakout logic.
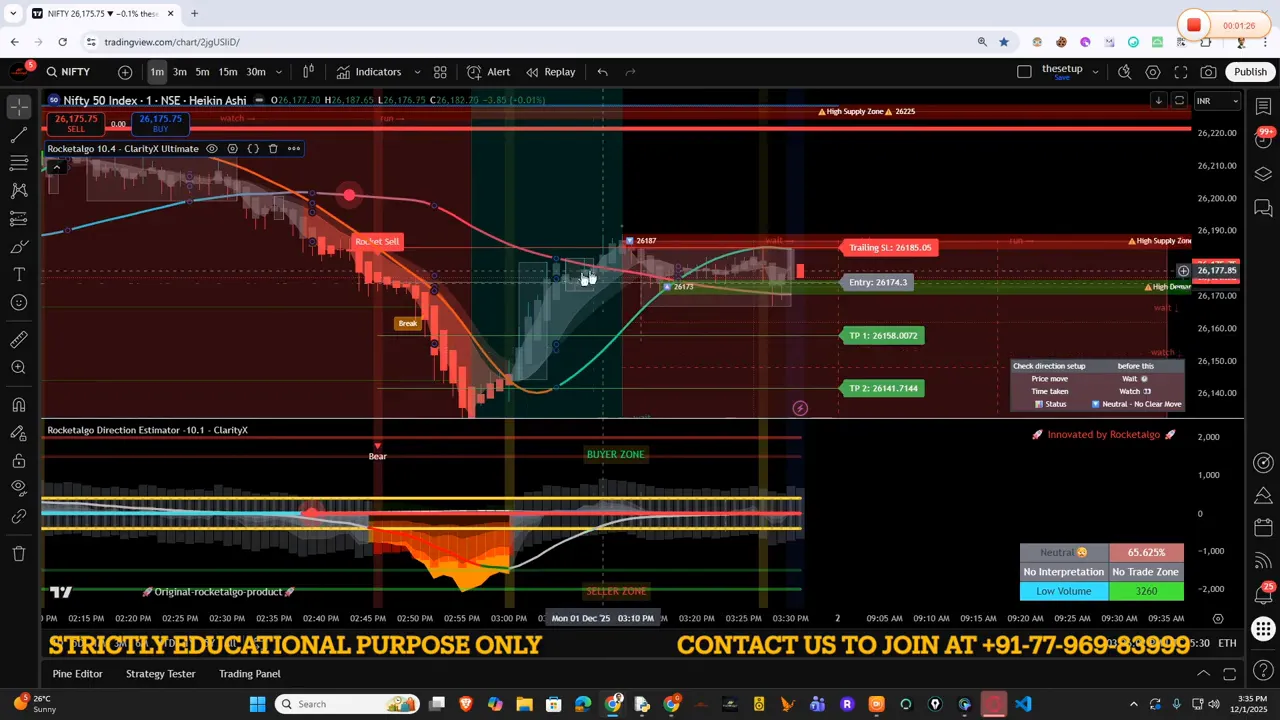
📈 Trade management: capturing moves and booking profit
Practical trade steps for using this framework:
- Wait for alignment — money flow direction, zone color, and angle breakout should align before taking a full-sized trade.
- Scale in — if the angle breakout shows momentum, take an initial position and add at confirmed continuation points.
- Set targets — algorithms often project multiple levels. Use these as guides: take partial profits at each level and trail the stop for the rest.
- Book profits when context flips — if the price re-enters the opposite color zone or the money flow reverses, reduce exposure or exit.
When trades were aligned with the algorithmic signals, the move captured strong momentum. When setup conditions were violated, trades became choppy and produced little gain. This is why patience and alignment are more profitable than chasing every breakout.
📰 Market-moving news: when macro overrides the setup
Not every move is technical. Fundamental announcements can change implied risk instantly and cause negative or positive market reactions even if technical signals looked neutral.
Example: midcap weakness after PSU bank merger speculation. News about a possible mega PSU bank merger and plans to sell stakes in smaller public sector banks introduced uncertainty. The market reacted negatively because the implied future performance of those smaller banks looked weaker. That move created an earlier-than-expected downshift in money flow and led to sell-side momentum in midcaps.
Rule of thumb:
- Respect headline risk — when a credible macro or government-related news item appears, give it priority even over a technical setup.
- Expect short-term overreactions — markets often price uncertainty aggressively. Use algorithmic signals to see if the reaction is absorption (temporary) or the start of a new trend.
- Confirm before re-entering — after a news-led move, wait for money flow and zone alignment before initiating new positions in the direction of the move.

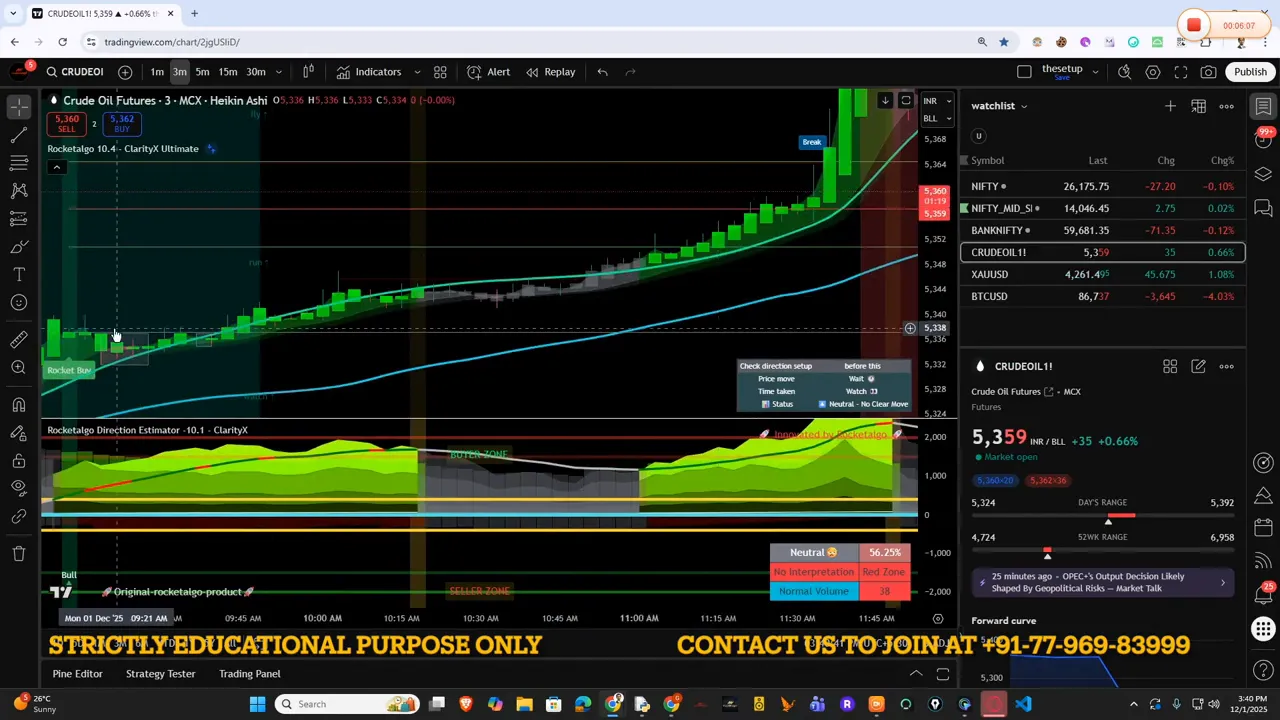
🛢️ Commodities, crude, and global context
Commodities often move on a different clock than equities. Global events such as diplomatic visits, summit outcomes, and conflict friction influence commodities like crude oil.
Recent dynamics to consider:
- Russia-Ukraine tensions easing slightly led to lower risk premiums on crude, causing a pullback in oil prices earlier.
- G7 meetings and geopolitical travel by heads of state can create waves in commodity flows; even expectations of demand changes impact price.
- Commodities prefer higher time frames for trade decisions. Use 3-minute or higher time frame confirmations for entries.
Even within commodities, algorithmic signals work well. For example, crude attempted a bounce that required confirmation on money flow and angle structure before it could be traded confidently. Trade only when higher time frame alignment confirms the intraday setup.
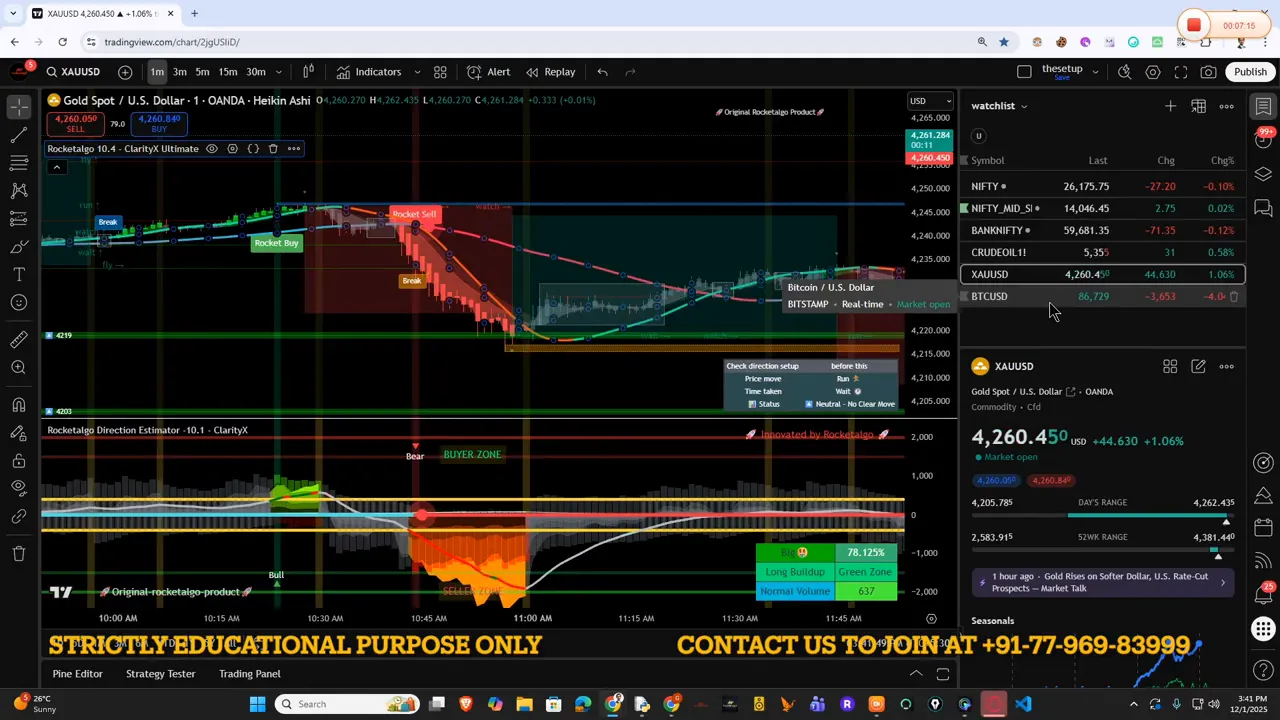
🥇 Gold and mean reversion
Gold exhibited a measured attempt to climb back toward what the algorithm considered its fair value. When an asset is pumped beyond reasonable levels, mean reversion logic suggests it will return toward fair value — for this gold cycle, that level was around the mid-80s in the quoted measure of the session.
When you see a rapid pump without corresponding money flow support, treat the rally as suspect and expect correction toward fair value. Conversely, if money flow supports the move and angles form cleanly, the rally can be real.
📆 Seasonality and why December feels slow
December often looks quieter on major exchanges. The simplest explanations are the most reliable:
- U.S. markets slow down due to holidays; liquidity decreases worldwide and volatility often compresses.
- Market participants take time off during the holiday season, resulting in fewer new position initiations and less impulsive movement.
- Local retail and institutional calendars (festivals, end-of-year bookkeeping) also reduce active market participation for a few days.
Because of lower participation, many breakouts around this time are false or lack follow-through. That is why the algorithmic approach of waiting for alignment is particularly valuable in December — it prevents overtrading and helps focus only on clean, confirmed opportunities.
🧭 Practical checklist before taking a trade
Use this short checklist every time you consider entering a position in the trading, stock market, NSE, BSE, Nifty ecosystem:
- Money flow direction matches trade bias
- Zone color supports the direction
- Angle formed and breakout with momentum
- No overriding headline risk or macro event
- Defined targets and stop-loss
When all boxes are ticked, the trade becomes a statistical edge rather than a guess.
🛡️ Risk management and trader psychology
One user asked whether not owning a particular asset reduces the ability to be decisive. The practical response is simple: do not panic. Markets go up and down; the objective is to manage risk and capitalize on clear setups. Being out of a trade is not the same as being wrong.
Key risk management ideas:
- Use position sizing aligned to a percentage of capital rather than trying to time perfect entries.
- Book partial profits and trail stops when the algorithmic targets are hit.
- Respect market signals: if money flow flips, reduce exposure.
Keeping emotions under control and letting alignment guide actions is how consistent results emerge over time.
🚀 Where algorithmic systems add the most value
Algorithms consolidate small, noisy signals into readable patterns. Their biggest wins are:
- Reducing noise by highlighting dominant money flow
- Identifying zones where retail interest clusters and can be taken advantage of by larger flow
- Projecting multiple targets to help scale exits
They do not eliminate risk but improve the odds by providing disciplined filters for trade entry and management. The human role is to interpret context, respect news events, and manage execution and psychology.
Key takeaways
- Alignment matters: money flow, zone, and angle breakout working together provide the best setups.
- Watch for false signals: green candles in a red zone or breakouts without momentum are common traps.
- News can override tech: give credible macro announcements priority and confirm before re-entering.
- Trade with a plan: define targets and stops; scale in and out using algorithmic projections.
- Seasonality affects liquidity: December and holiday periods often reduce trade quality; be selective.
❓ Frequently Asked Questions
How does the money flow line differ from volume and why should I rely on it?
Money flow is a smoothed indicator that captures buying and selling pressure over a period and reduces noise compared with raw volume. It aggregates directional intent and helps confirm whether price moves have real capital support. Use it alongside volume, not as a replacement.
What exactly is a red zone or green zone on a chart?
A zone is a visual representation of demand or supply dominance. A red zone indicates supply pressure and expected downward bias; a green zone indicates demand and upward bias. Candles moving against the zone should be treated cautiously until momentum confirms a flip.
When should I act on an angle breakout?
Act when three conditions align: the angle is formed and breaks, the money flow supports the breakout direction, and candles show momentum (clear follow-through). If any of these are missing, wait for confirmation or avoid the trade.
How do major news events change algorithmic signals?
News can change implied risk and cause immediate changes in money flow. A credible headline can create sustained moves that override prior technical bias. After a news-led move, use algorithm signals to see whether the reaction is transient or the start of a new trend.
Is December a bad time to trade?
Not bad, but different. Liquidity often decreases due to holidays and reduced participation, increasing the chance of false breakouts and choppy action. Use stricter alignment rules and prefer high-probability setups during this period.
🔗 Final thoughts and preparation for next steps
Trading consistently on the trading, stock market, NSE, BSE, Nifty hinges on disciplined rules and context-aware execution. Use algorithmic signals to reduce noise, but keep human judgment for macro news and position management. When money flow, zone color, and angle breakout align, that is where the market hands you opportunities. When they diverge, accept the market’s uncertainty and step aside until clarity returns.
Practice scanning for these three signals daily. Keep a trading journal that notes when alignments succeed and when they fail. Over time you will see the edge: the same framework applies across equities, midcaps, commodities, and even gold. Build patience, keep risk small, and let confirmed momentum do the work.
Need more help |
|
Contact us by clicking the button below |
| Click me |

