

This guide explains a practical, repeatable approach to intraday momentum trading on Indian exchanges. If you trade Nifty or single-stock options on NSE and BSE and want a clear framework for capturing directional moves while avoiding sideways noise, this article covers rules, entry signals, position sizing, trade management, and common pitfalls. The phrase trading, stock market, NSE, BSE, Nifty appears throughout to keep focus on real-world Indian market setups.
Table of Contents
- 🔎 Why momentum trading matters for Nifty and index traders
- ⚙️ Core concept: zone, angle, money flow
- 📈 How to read entry zones and prepare trade plans
- 🛠️ Step-by-step entry checklist for intraday momentum trades
- 📊 Example trade: converting signal to orders
- 🖼️ Visual example: premium move and result
- ⚖️ Trade management rules to protect capital
- 🚫 Common pitfalls and how to avoid them
- 🧭 How to choose timeframes and instruments 😊
- 🔍 Indicators and tools that add value 😊
- 🧾 Practical checklist before placing a momentum trade 😊
- 💡 Behavioral rules traders must follow 😊
- 📉 Edge cases and how to handle them 😊
- 🔁 Frequently asked questions
- ✅ Summary and next steps
- 🔗 Keywords to follow (for practice and research)
🔎 Why momentum trading matters for Nifty and index traders
Most intraday price action is range-bound. Experienced traders estimate that markets spend roughly two thirds of the time in sideways action and one third in clear momentum moves. The objective of momentum trading is simple: identify when the market moves decisively and participate with a defined plan. That one third of time produces most of the tradable profit opportunities and reduces time spent fighting noise.

⚙️ Core concept: zone, angle, money flow
A reliable setup blends three simple signals:
- Zone — predefined price areas where buyers or sellers tend to participate (support/resistance, value zones, pre-market shades).
- Angle — the slope or rate of change of price movement. A clear upward or downward angle suggests momentum building; a flat angle means indecision.
- Money flow — a confirmation metric showing buying/selling participation (volume spikes, tick momentum, or flow percentage indicators).
When a price touches a participation zone while the angle turns favorable and money flow confirms, the probability of a sustained move increases. Entering on the early phase of that confluence offers high reward-to-risk.
📈 How to read entry zones and prepare trade plans
Define your zones before market open. Use pre-market levels, prior session high/low, and visibly clustered price action as your zones. Color-coding them helps: green for buyer-interest zones and red for seller-interest zones.
- Pre-market red zone near a resistance area suggests potential selling if a price tests and rejects it.
- Green zones near support are where buyers can step in and start an upward move.
- Watch for candles crossing out of a shaded zone and forming an angle away from that zone — that is your alert to prepare an entry.
🛠️ Step-by-step entry checklist for intraday momentum trades
- Identify the zone: Mark pre-market and prior-session zones on 1- to 5-minute charts.
- Wait for angle formation: Look for a clear slope in price direction on the timeframe you trade.
- Confirm with money flow: Check volume, time and sales, or a money-flow indicator for buying/selling intensity.
- Use a confirmation candle: Prefer an entry after a strong candle that moves out of the zone in the angle direction.
- Set stop loss and target: Use nearby structural levels for SL and a minimum risk-reward of 1:1.5 or better.
- Position size: Risk a small fixed percentage (1–2%) of trading capital per trade. Convert that risk to lot size for futures/options.
📊 Example trade: converting signal to orders
Imagine Nifty tests a green support zone at 18,600. A clear upward angle starts and money flow rises. The confirmation candle closes above the zone on the 5-minute chart.
- Entry: buy Nifty futures (or call option) at market on confirmation candle close.
- Stop loss: below the support zone or below the confirmation candle low.
- Target: first target 1.5x risk; trailing with a breakeven + chunk once the first target is hit.
If you trade options, choose strikes with adequate Delta and liquidity so that time decay and spread do not erode expected returns. For quick momentum scalps, lower premium options with tight spreads work better; for larger trend capture, select nearer-to-the-money strikes.
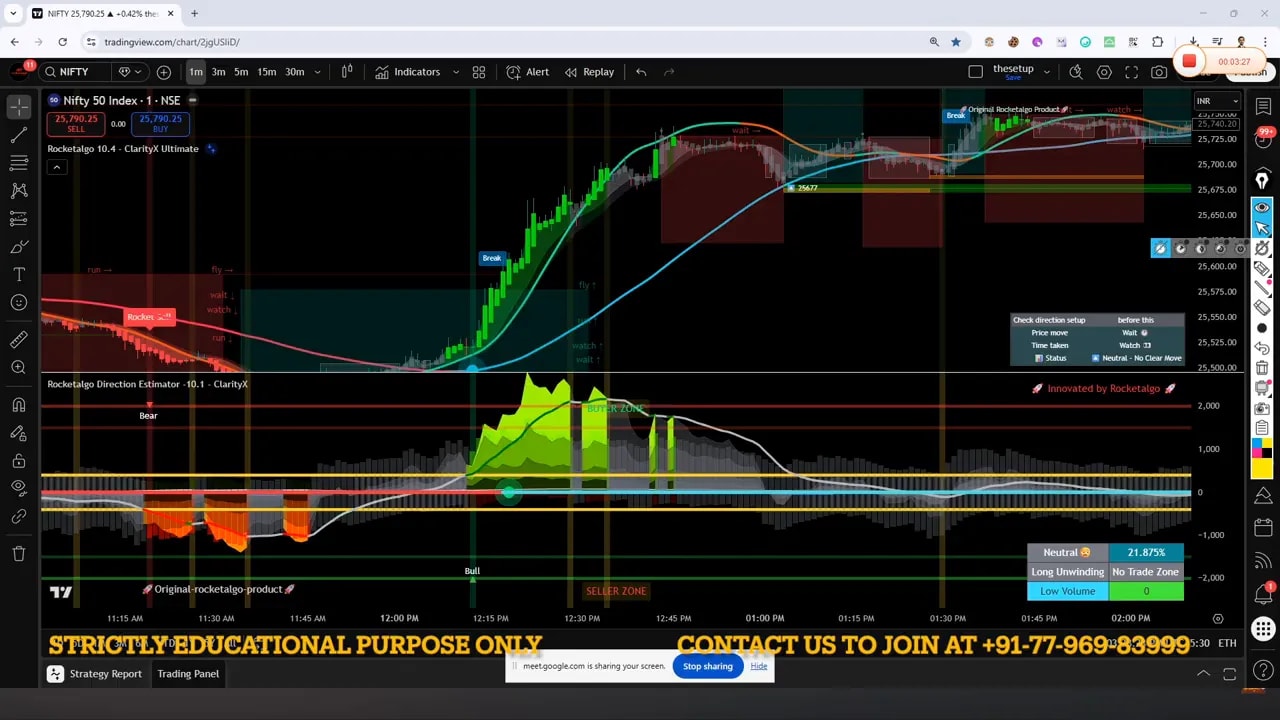
🖼️ Visual example: premium move and result

A single momentum swing can move option premiums sharply. When the underlying moves 50–100 points with clear participation, option premium amplifies gains. Always account for premia, implied volatility, and bid-ask spreads when sizing.
⚖️ Trade management rules to protect capital
- Rule of three: Many traders limit active entries to a maximum of three meaningful trades in a session to avoid overtrading and poor decision-making after wins.
- Predefine stop and target: Do not change the stop impulsively. If you move it, reduce position size or close part of the trade.
- Use breakeven and trail: After a trade reaches 1x risk, move stop to breakeven. Use trailing stops on sustained moves to capture more without giving back profit.
- Avoid revenge trading: If one trade performs well, resist the urge to immediately risk profit for speculative gains.
🚫 Common pitfalls and how to avoid them
Momentum setups are straightforward but often wrecked by human error. Avoid these mistakes:
- Trading during sideways market: Attempting momentum trading when angle and money flow are absent leads to small choppy losses. Wait for the confluence.
- Following unfounded tips: External tips without a structural plan are dangerous. Trade your setup, not others’ hot tips.
- Overleveraging: Using oversized lots because of greed amplifies losses quickly. Keep position size consistent relative to capital.
- Blind auto-trading: Automated systems without robust testing can fail across regimes. If using auto-trade, monitor live performance and limit daily exposure.
- Neglecting liquidity: Thin option strikes produce large slippage. Use liquid strikes and check open interest and volume.
🧭 How to choose timeframes and instruments 😊
Timeframe choice depends on personality and capital:
- Scalpers: 1-minute and tick charts capturing 10–30 point moves on Nifty. Requires fast execution and low latency.
- Intraday traders: 5-minute charts to capture momentum waves of 30–150 points in a session.
- Swing traders: 15-minute and hourly charts to ride larger trends over several sessions.
For instruments, use index futures for directional clarity and liquidity. Options offer asymmetric returns but require awareness of Greeks and implied volatility risk.
🔍 Indicators and tools that add value 😊
Keep indicators simple. Useful tools include:
- Volume profile or pre-market shaded zones to find participation areas.
- Money flow index or cumulative delta to confirm buying or selling pressure.
- Slope/angle measurement (rate of change) to assess momentum strength.
- VWAP for institutional fair-value reference, especially intraday.
Avoid stacking many lagging indicators. The best setups rely on price, volume, and clear rules for entry/exit.
🧾 Practical checklist before placing a momentum trade 😊
- Zones drawn (pre-market & previous session)
- Angle assessed on chosen timeframe
- Money flow or volume confirmed
- Liquidity and strike choice verified
- Stop loss and target set in advance
- Position size calculated based on percent risk
- Maximum daily trade count limit set (e.g., 3)
💡 Behavioral rules traders must follow 😊
- No chasing tips: Treat unsolicited market tips skeptically. Trade your plan.
- Keep emotion out: Take breaks, avoid trading when fatigued or distracted.
- Review trades: Journal entries and exits daily to learn patterns and mistakes.
- Keep a stop-first mindset: Always place stop loss immediately after entry to guard against gaps or surprises.
📉 Edge cases and how to handle them 😊
Every method faces edge cases. Here are common ones and practical responses:
- False breakouts: When angle is sharp but money flow is weak, treat the move as suspect and use smaller size or tighter stops.
- News spikes: Major economic releases can create unpredictable volatility. Avoid trading into high-impact news unless you have a news-specific strategy and wider stops.
- Pre-market skew: Pre-market shading can mislead — confirm with first 15 minutes of regular trading if you are uncertain.
- Auto-trade slippage: If an automated system underperforms live compared to backtest due to slippage or latency, halt it and re-evaluate the execution logic.

🔁 Frequently asked questions
How much capital do I need to start momentum trading on Nifty?
Capital depends on instrument and risk per trade. For futures, consider starting with enough margin to manage 1–2% risk per trade. For options, ensure you can buy liquid strikes and withstand premium volatility. Many traders start with at least a few thousand dollars or equivalent INR to size positions sensibly. Always calculate position size from maximum permitted loss rather than desired gain.
Which timeframe is best to spot the angle and entry?
Most intraday momentum traders use 5-minute charts for the main signal and 1-minute charts for precise entries. For very fast scalps, 1-minute or tick charts are favored. The key is consistency: build rules for the timeframe you intend to trade and test them across many sessions.
How do I manage risk when trading options on Nifty?
Select strikes with adequate open interest and avoid illiquid far-OTM contracts. Account for implied volatility and choose premium levels where a move in the underlying produces meaningful premium change. Use defined risk per trade (for example 1–2% of capital) and convert that into premium exposure. Consider buying vertical spreads to limit risk if premium decay or IV crush is a concern.
Is auto-trading a good idea for momentum strategies?
Auto-trading can remove emotion and execute orders faster, but it introduces execution and model risk. Backtest across different market regimes, include slippage and latency in simulations, and monitor live performance closely. Limit auto-trade exposure until you are confident in real-world execution.
How to avoid overtrading after a winning session?
Set rules: a maximum number of trades per day (for example three), a stop trading after a certain profit target is reached, and a fixed loss limit after which you stop for the day. These guardrails reduce impulse decisions and protect gains.
What indicators should I avoid?
Avoid indicator clutter. Steer clear of too many lagging moving averages or complex oscillator stacks that conflict. If an indicator does not change your decision-making consistently over many trades, remove it.
✅ Summary and next steps
Momentum trading on NSE and BSE instruments like Nifty is a high-probability approach when you combine zones, angle, and money flow. Use a pre-defined checklist for entries, strict position sizing, and disciplined trade management. Limit trades per day, avoid tips that do not fit your setup, and treat automation with caution. The system is simple in concept but requires disciplined execution, journaling, and continuous refinement.
🔗 Keywords to follow (for practice and research)
- trading, stock market, NSE, BSE, Nifty
- momentum trading Nifty
- intraday strategies NSE
- money flow indicator Nifty
- zone-based trading
Follow the checklist, keep rules simple, and review performance weekly. Good risk controls and consistent execution create long-term edge in trading. Trade small, protect capital, and let the market reward disciplined setups.
Need more help |
|
Contact us by clicking the button below |
| Click me |

