
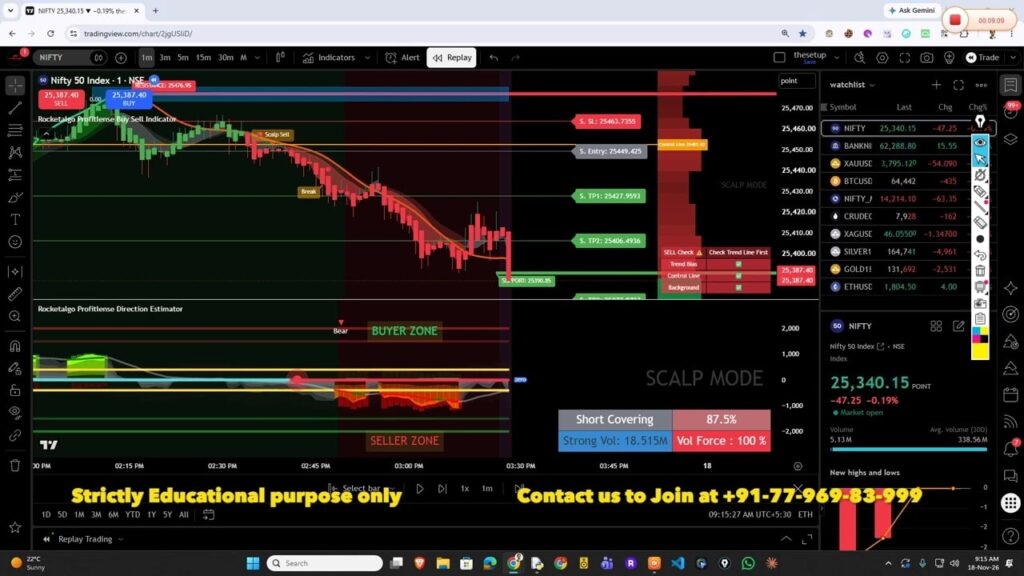
A buy or sell signal is only one part of a trading setup. The real question is whether direction, momentum, money flow, and liquidity dominance are supporting that signal.
Our November 18, 2026 update brings Rocketalgo and Profit Lens together into a unified buy-sell indicator setup for Indian and US markets. It also addresses loading performance and adds more context through support and resistance levels. But before using those features, get one basic thing right: make sure your chart is receiving live data.
If TradingView is showing a “D” beside your NSE instrument, start with the broker connection process below. Then work through the updated chart-reading rules. There is no benefit in rushing into a trade before understanding what the setup is telling you.
Table of Contents
- What Has Changed in the Rocketalgo Update?
- How to Fix NSE Data Delay in TradingView
- How to Apply the Updated Rocketalgo Indicators
- Read the Setup in Order: Angle, Breakout, Momentum, and Control
- How to Interpret the New Support and Resistance Levels
- The Nifty Example: Why Waiting at the Open Mattered
- What “Institutional Sentiment” Means in This Framework
- A Practical Checklist Before Acting on a Signal
What Has Changed in the Rocketalgo Update?
The main change is the integration of Rocketalgo and Profitlense prointo a coordinated buy-sell setup. The updated tools are available through TradingView’s Invite-only indicators section for accounts with access.
The update focuses on several things working together:
- Buy, sell, and scalp signals to identify potential setups.
- The direction line and its angle to help distinguish directional movement from a flat market.
- The control line and liquidity zones to indicate which side the model identifies as dominant.
- The money flow line to add context to price movement and pauses.
- Updated support and resistance levels to highlight areas where a move may slow down or encounter demand.
- Loading improvements intended to address issues some users experienced when applying the indicators.
Early feedback has been encouraging, with users reporting examples of buy and sell signals followed by moves toward the displayed targets. We also examined examples where scalp-sell signals caught downward momentum and buy signals aligned with upward moves in Nifty. Those examples are useful for learning the setup, but they are not a promise that every signal will achieve its targets.
How to Fix NSE Data Delay in TradingView
The method demonstrated in this update is straightforward: connect an eligible broker account through TradingView, authorize the connection, and refresh the chart.
For this workflow, our suggested brokers were Dhan, Upstox, and Fyers. Angel One was not recommended for this particular issue because it was not resolving the delay in our experience at the time. That is a workflow-specific observation, not a conclusion about every feature of the broker.
Desktop setup
- Open your NSE chart in TradingView and check whether the delayed-data “D” is visible.
- Click either the Buy or Sell button to open the broker connection options. This step is for accessing the connection panel, not for placing a trade.
- Select the supported broker with which you have an account, such as Dhan, Upstox, or Fyers.
- Click Connect.
- Complete the broker login and accept the connection authorization request.
- Return to TradingView and refresh the chart or indicator setup.
- Check that the data status has changed before relying on the chart for live decisions.
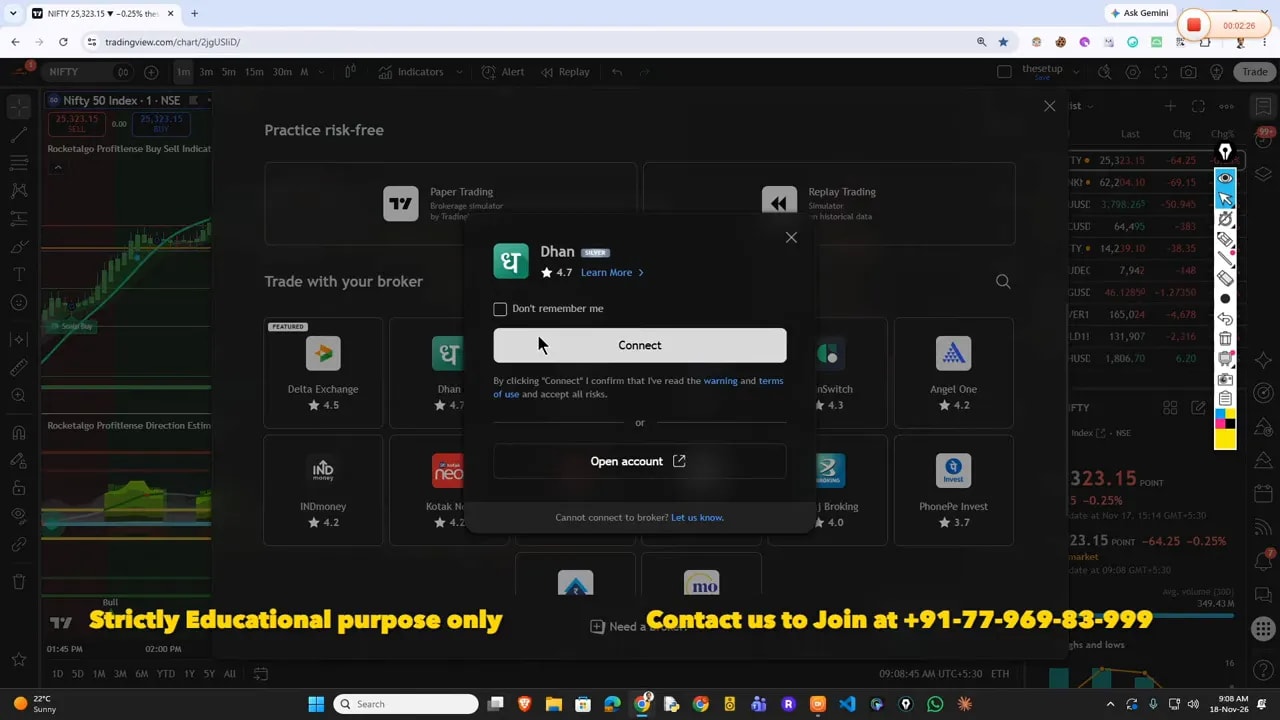
If you already have an eligible account, the connection itself should be a short process. If you do not, you will first need to complete the broker’s account-opening requirements.
The benefit discussed in the update was avoiding a separate data expense estimated at around ₹1,500 per month. Treat that as an estimate from the demonstrated setup, not a universal current price or guaranteed saving. Broker eligibility, exchange permissions, and data access terms still need to be checked for your account. TradingView’s official Help Center is a useful reference for current connection and market-data requirements.
Mobile setup and refresh troubleshooting
The mobile process follows the same idea: use the Buy or Sell button to reach the broker options, select your broker, and complete the login and authorization.
If the delay indicator remains after connecting:
- Refresh the broker connection.
- Refresh TradingView.
- If necessary, fully close the app by swiping it away, then reopen it.
- Recheck the data status rather than assuming the connection has taken effect.
Connecting and refreshing are separate steps. Do not stop after the login screen. Return to the chart and confirm the result.
How to Apply the Updated Rocketalgo Indicators
Once the data connection is ready, load the current indicator setup rather than continuing with an older chart configuration.
- Remove the existing indicators. In the demonstration, the combined Remove drawings and indicators option was used, so be aware that this also removes chart drawings.
- Open Indicators in TradingView.
- Go to Invite-only, or use Favorites if you have already saved the tools there.
- Apply the two updated Rocketalgo and Profit Lens components available to your account.
- Allow the chart to finish loading before interpreting the signals and levels.
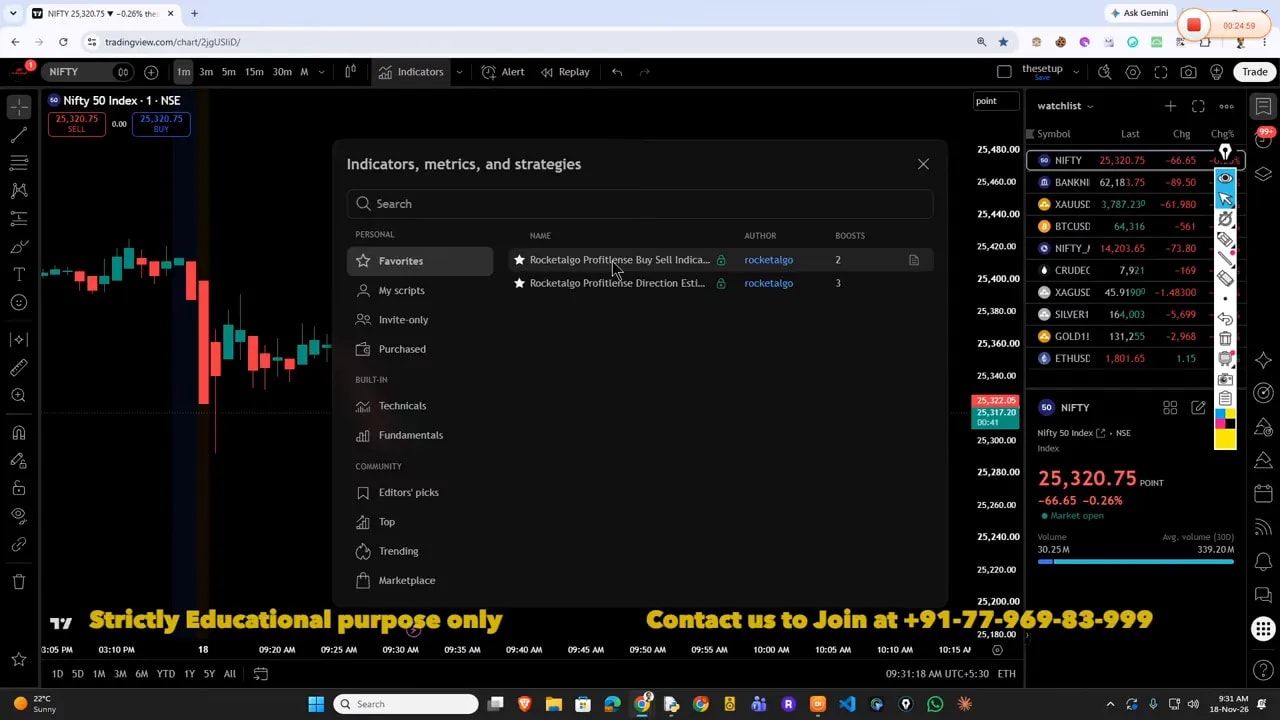
Although the update combines the tools into one coordinated system, the installation demonstrated still involves applying two indicator components. Loading performance has also been improved to address earlier loading complaints.
The update covers Indian and US markets. At the time of this release, a further US-market update was planned for later that day.
Read the Setup in Order: Angle, Breakout, Momentum, and Control
Now comes the important part. Do not reduce the system to “a sell appeared, so I must sell.” Read the conditions around the signal.
1. Start with the direction-line angle
Look at the direction line first. Is it clearly angled in the direction of the proposed trade, or is it moving flat?
In the downward example, the sell signal was supported by a direction line pointing lower. As the directional structure opened up, price moved more decisively toward the next levels. This opening is what we describe as the setup opening its “mouth.”
A flat line tells a different story. It can accompany fluctuations, small reversals, and uneven movement even when the broader bias remains bearish. A directional bias is not the same thing as strong momentum.
2. Identify whether the breakout has already happened
Locate the breakout in the structure. Once price has broken the relevant level and established a downtrend, do not keep demanding another fresh breakout at every candle.
In the Nifty example, the initial break had already occurred. The next task was to judge whether the move still had support from the angle, price structure, money flow, and liquidity reading. Chasing another breakout simply because the first one was missed is not a disciplined reason to enter.
3. Look for stair-step price movement
When candles progress like stairs in the trade’s direction, the movement has a more orderly momentum structure. In a downward move, that means price continuing lower in a recognizable sequence rather than repeatedly jerking back and forth.
If that staircase is missing, acknowledge it. A market can drift lower under seller dominance without offering the clean momentum you want.
4. Check which side the control line favors
The control line is our way of asking: which side does the model identify as controlling liquidity?
During the bearish examples, the control reading remained in the seller-dominant zone. That helped explain why brief upward reactions did not immediately become sustained bullish moves.
Read the line’s zone and surrounding context, not an isolated color change. A small green indication within a broader seller-dominant structure is not, by itself, enough to establish a bullish reversal.
5. Use the money flow line as context
Price and the money flow line do not always move in a perfectly synchronized way. In one example, the money flow line moved toward price while the downward candle movement paused.
That was a reason to consider booking profit and waiting rather than forcing the original expectation. Price later turned away from the money flow area and resumed lower, breaking support and reaching the next level.
The lesson is simple: you can book a profitable trade and wait for the structure to become clear again. You do not have to remain exposed through every pause.
How to Interpret the New Support and Resistance Levels
The updated levels help identify where a move may hesitate. In the sell example, price approached one support, paused, broke it, and then moved toward another support displayed below.
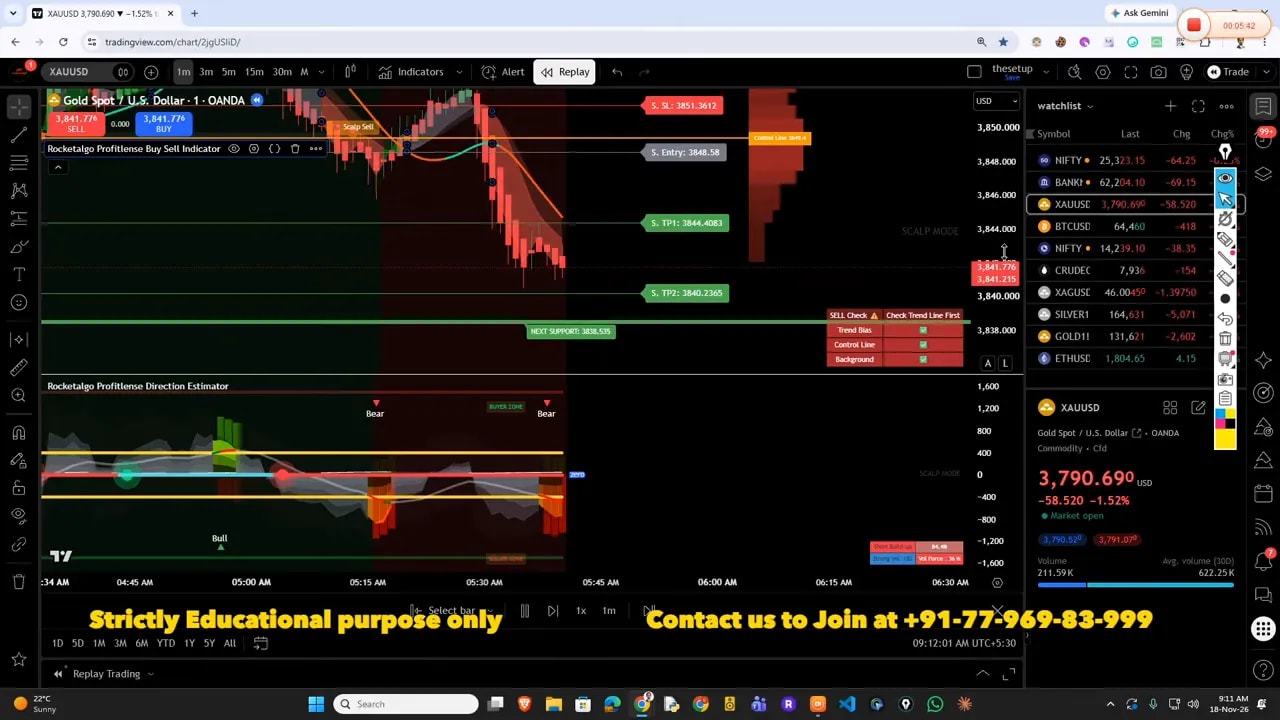
Pay attention to the sequence:
- A sell signal appears with a downward direction-line angle.
- Price approaches nearby support and may flatten or hesitate.
- If the bearish structure continues and support breaks, the next support becomes relevant.
- At each new level, reassess momentum and the control reading.
These are dynamic, volume-sensitive readings in our framework. Levels can update as the structure changes. Do not assume that a level disappearing or being replaced guarantees what the next candle will do.
We also discussed a confirmed swing low formed while RSI was oversold. Such an area adds context to the support reading, and the candle close relative to that low matters when assessing whether the decline is continuing. Oversold conditions alone do not settle the direction.
Later in the Nifty example, the move slowed where support and a high-demand area appeared together. That combination was a reason to reassess the trade and consider profit booking rather than expecting the same pace of decline indefinitely.
The Nifty Example: Why Waiting at the Open Mattered
The Indian market opening provided an important lesson in patience. A sell signal from the previous afternoon had already been followed by a downward move, and the displayed third target was reached around the next opening.
That did not automatically make the opening a good place for a fresh trade.
Initially, the chart showed mixed short-term behavior. Seller dominance remained visible, but the direction line was flat at points, and green or gray changes appeared within the broader bearish structure. There were also repeated covering moves.
Under those conditions, the message was clear: there was no need to force an immediate entry.
This is where panic trading creates problems. A trader sees a quick drop, enters late, then reacts emotionally to the first upward fluctuation. Instead, separate the questions:
- Is the broader structure bearish?
- Is the current angle strong enough?
- Is there clean momentum right now?
- Has the trade already reached important targets?
- Is nearby support or demand likely to interrupt the move?
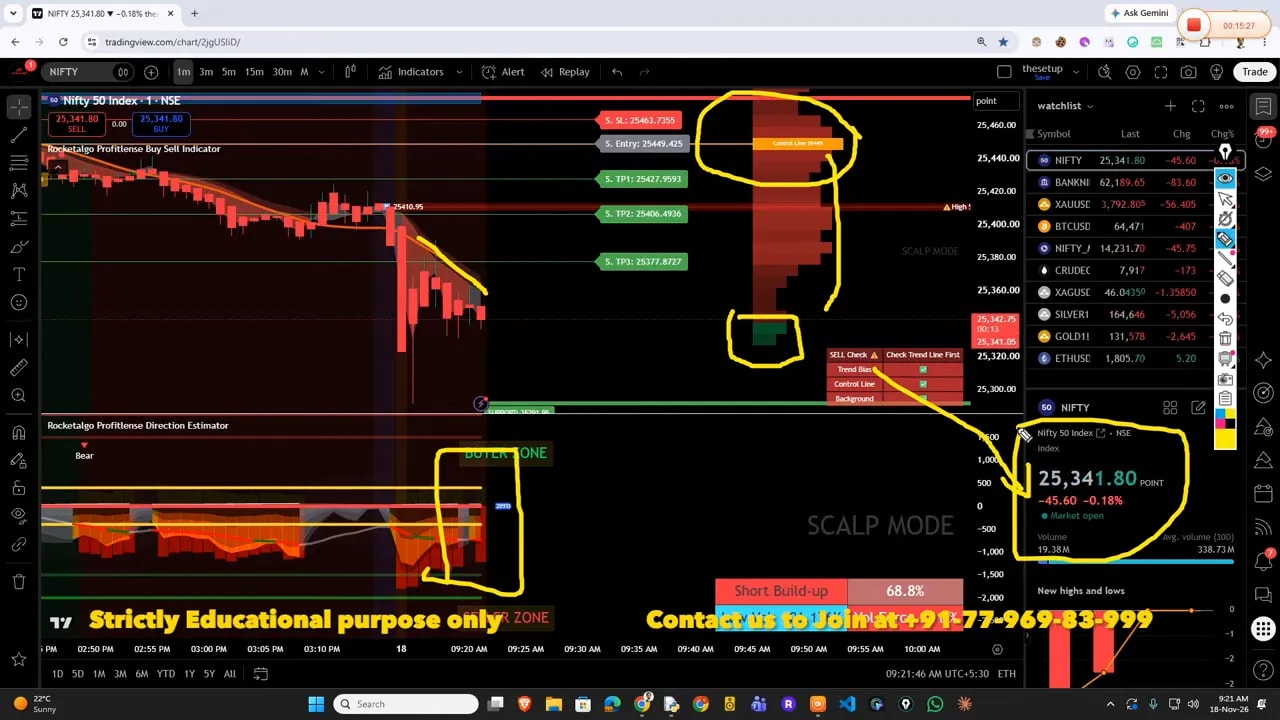
As the example developed, the downward angle became clearer while price remained below the money flow line and the control reading continued to favor sellers. The displayed Nifty decline expanded from roughly seven points down early in the observation to around 100 points down later.
That was an illustration of several conditions aligning during a live market move. It was not a record of an executed trade, a measured options return, or evidence that the next setup will behave the same way.
Why Bank Nifty was not equally attractive
Bank Nifty did not show the same strength. Its direction line had not opened into a convincing move, and the momentum reading was weak.
There was no reason to insist on trading Bank Nifty simply because Nifty was moving. Choose the clearer structure, not the instrument you feel compelled to trade.
What “Institutional Sentiment” Means in This Framework
The institutional discussion used a simple size comparison: imagine a smaller trader taking 10 or 100 lots while a much larger participant takes a position measured in thousands of lots.
The point of the comparison is that your personal preference does not determine market direction. Larger participants can bring much greater capital and research resources to the market. Fighting the prevailing pressure simply because you prefer a call or a put is not a sound approach.
But keep the analogy in its proper place. It is not proof that one large participant’s options position must dictate the market, and the indicator does not establish the identity or actual holdings of a named investor.
Our institutional-sentiment reading is an inference within the indicator framework. Use it alongside the control line, direction, money flow, and actual price behavior. In the Nifty example, the bearish sentiment reading became more useful when it aligned with the developing downward angle and seller-dominant structure.
A Practical Checklist Before Acting on a Signal
Keep the process disciplined. Before acting on a Rocketalgo buy or sell signal, check the following:
- Data: Is the chart receiving live NSE data, with the broker connection confirmed?
- Version: Have the updated indicator components loaded correctly?
- Angle: Is the direction line clearly angled, or flat and indecisive?
- Breakout: Where did the relevant break occur, and are you chasing an already extended move?
- Momentum: Are candles progressing cleanly, or moving in repeated jerks?
- Control: Which side does the broader liquidity reading favor?
- Money flow: Does the price relationship support continuation or suggest a pause?
- Levels: Is support, resistance, or a demand area close enough to interrupt the move?
The strongest lesson from this update is not “take every signal.” It is to read the whole setup, avoid forcing trades at the opening, and recognize when booking profit and waiting is the more sensible decision.
Educational notice: Rocketalgo is not a SEBI-registered investment adviser. This material is for education, not a recommendation to buy or sell any security. Trading can involve significant losses, information may be incomplete or incorrect, and past performance does not guarantee future returns. Do your own research and consult a qualified financial adviser before making trading decisions.

