
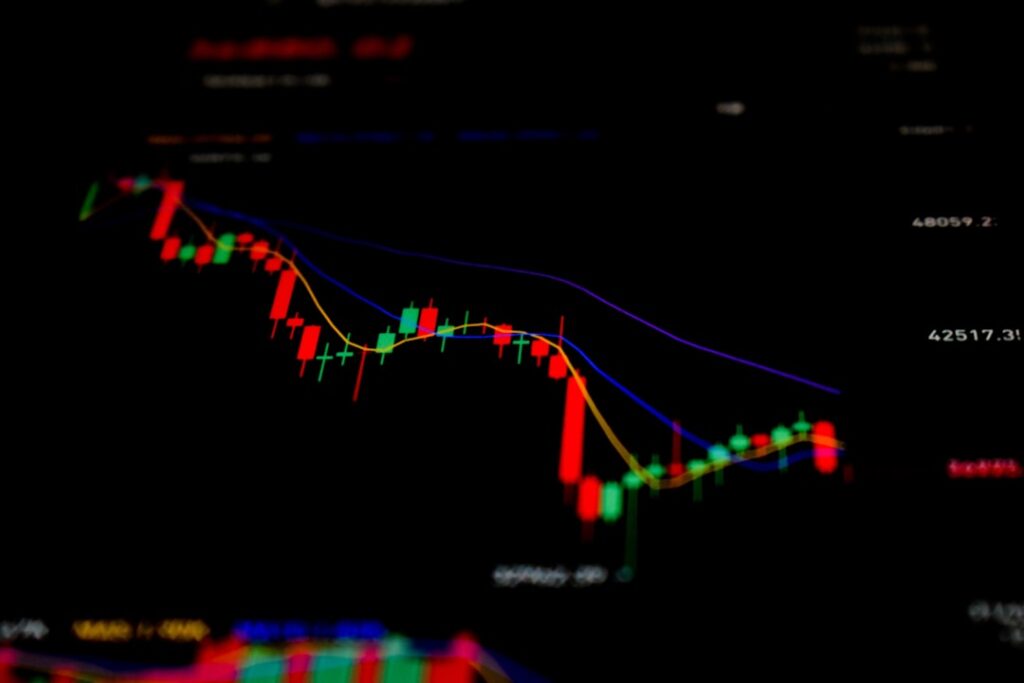
In the dynamic and often unpredictable world of financial markets, one of the most enduring and widely practiced strategies is trend following. The core principle is deceptively simple: identify the prevailing direction of the market and ride that wave for as long as it lasts. While the concept is straightforward, the execution requires a deep understanding of market mechanics and, crucially, the right tools. This comprehensive guide will demystify trend following indicators, providing traders with the knowledge and insights needed to effectively integrate them into their strategies.
Understanding the Philosophy of Trend Following
Before diving into the specifics of indicators, it’s essential to grasp the underlying philosophy of trend following. Unlike other trading styles that focus on predicting market reversals or finding intrinsic value, trend followers embrace the idea that markets, once set in motion, tend to continue in that direction for a sustained period. This momentum-driven approach thrives on the psychological biases of market participants – the herd mentality that drives prices further in one direction once a trend is established.
The Appeal of Trend Following
- Simplicity: The core idea is easy to grasp, making it accessible to both novice and experienced traders.
- Objectivity: Indicators provide quantifiable signals, reducing emotional biases in decision-making.
- Scalability: Trend following strategies can be applied across various asset classes and timeframes.
- Profitability in Volatile Markets: Trends often emerge during periods of high volatility, presenting significant profit opportunities.
The Challenges of Trend Following
- Whipsaws: Markets don’t always trend smoothly; periods of choppy or sideways movement can generate false signals and lead to losses.
- Late Entry/Exit: Trend following inherently means you’re not buying at the absolute bottom or selling at the absolute top.
- Requires Patience: Trends can take time to develop and unfold, requiring traders to resist the urge to jump in or out prematurely.
- Significant Drawdowns: Following large trends can also mean enduring significant pullbacks or corrections during the trend’s life.
Moving Averages: The Cornerstone of Trend Identification
Moving averages (MAs) are arguably the most fundamental and widely used trend-following indicators. They smooth out price data over a specified period, providing a clearer picture of the underlying trend by filtering out short-term price fluctuations. By observing the direction and crossover of different MAs, traders can gain valuable insights into market momentum.
Simple Moving Average (SMA)
The SMA calculates the average price of an asset over a given number of periods. For example, a 50-day SMA takes the average closing price of the last 50 trading days.
- Calculation: Sum of closing prices over ‘n’ periods / ‘n’
- Interpretation: When the current price is above the SMA, it suggests an uptrend. Conversely, when the price is below the SMA, it indicates a downtrend. A rising SMA confirms an uptrend, while a falling SMA confirms a downtrend.
- Applications:
- Trend Confirmation: Longer-period SMAs (e.g., 200-day) are excellent for identifying long-term trends.
- Support and Resistance: SMAs often act as dynamic support and resistance levels.
- Crossover Strategies: The intersection of two SMAs (e.g., a 50-day SMA crossing above a 200-day SMA) can signal a potential trend reversal or continuation.
Exponential Moving Average (EMA)
Unlike the SMA, the EMA gives more weight to recent price data, making it more responsive to current price changes. This responsiveness can be an advantage for traders seeking earlier trend signals.
- Calculation: More complex than SMA, involving a smoothing factor.
- Interpretation: Similar to SMA, but often provides earlier signals due to its responsiveness.
- Applications:
- Faster Trend Identification: EMAs can help catch new trends sooner than SMAs.
- Entry/Exit Signals: Crossovers of EMAs (e.g., 9-period EMA crossing above 26-period EMA) are popular entry/exit signals in various trading systems.
- Combined with Other Indicators: EMAs are frequently used in conjunction with other momentum indicators.
Weighted Moving Average (WMA)
The WMA is another type of moving average that assigns more importance to recent data points, similar to the EMA, but using a different weighting method.
- Calculation: Each data point is multiplied by a weighting factor, with more recent data having higher weights.
- Interpretation: Offers a balance between the smoothness of SMA and the responsiveness of EMA.
- Applications: Less commonly used than SMA and EMA, but can be effective for specific trading strategies requiring a particular weighting scheme.
Trend Strength Indicators: Gauging Momentum and Confidence
While moving averages help identify the direction of a trend, trend strength indicators assess the conviction behind that move. A strong trend is more likely to continue, whereas a weak or fading trend might be on the verge of consolidation or reversal.
Average Directional Index (ADX)
The ADX is a popular and versatile indicator that measures the strength of a trend, regardless of its direction. It typically ranges from 0 to 100.
- Calculation: Derived from the Directional Movement Index (DMI), which includes the Positive Directional Indicator (+DI) and Negative Directional Indicator (-DI).
- Interpretation:
- ADX above 25: Generally indicates a strong trend. The higher the ADX, the stronger the trend.
- ADX below 20: Suggests a weak or non-trending market (sideways movement).
- ADX falling from high levels: Can signal that a trend is losing momentum and might be due for a pause or reversal, even if the price is still moving in the trending direction.
- Applications:
- Filtering Trades: Avoid trading against strong trends (high ADX) and avoid trend-following strategies in weak markets (low ADX).
- Confirmation of Breakouts: A breakout accompanied by a rising ADX suggests a higher probability of a sustained move.
- Identifying Ranges: Low ADX values are indicative of ranging markets, where oscillators might be more suitable.
Moving Average Convergence Divergence (MACD)
The MACD is a momentum oscillator that reveals the relationship between two moving averages of a security’s price. It consists of the MACD line, a signal line, and a histogram.
- Calculation:
- MACD Line: (12-period EMA – 26-period EMA)
- Signal Line: 9-period EMA of the MACD line
- Histogram: MACD Line – Signal Line
- Interpretation:
- Crossovers:
- Bullish Crossover: MACD line crosses above the signal line – often a buy signal.
- Bearish Crossover: MACD line crosses below the signal line – often a sell signal.
- Zero Line Crossovers: MACD line crossing above the zero line suggests a shift to positive momentum, and vice-versa.
- Divergence: Discrepancy between price action and MACD.
- Bullish Divergence: Price makes lower lows, but MACD makes higher lows (potential reversal to the upside).
- Bearish Divergence: Price makes higher highs, but MACD makes lower highs (potential reversal to the downside).
- Applications:
- Trend Confirmation: The MACD histogram expanding in the direction of the trend confirms its strength.
- Early Entry/Exit Signals: Crossovers can provide relatively early indications of trend changes.
- Spotting Reversals: Divergence is a powerful tool for anticipating potential trend reversals.
Volatility-Based Indicators: Adapting to Market Swings
Trends often emerge or accelerate during periods of increased volatility. Volatility-based indicators help traders understand the degree of price fluctuations and can inform position sizing and stop-loss placement.
Bollinger Bands
Bollinger Bands consist of a simple moving average (SMA) and two standard deviation lines plotted above and below the SMA. They are particularly useful for identifying overbought/oversold conditions within a trending market.
- Calculation:
- Middle Band: N-period SMA
- Upper Band: N-period SMA + (N-period Standard Deviation * Multiplier)
- Lower Band: N-period SMA – (N-period Standard Deviation * Multiplier)
- Interpretation:
- Band Expansion (Squeeze Breakout): When the bands contract (squeeze) and then expand, it often signals the start of a new trend or increased volatility. A price breakout from a squeeze, especially if accompanied by volume, can be a strong signal.
- Price Riding the Bands: During a strong uptrend, prices often hug or ride the upper band. In a strong downtrend, prices tend to ride the lower band.
- Reversion to the Mean: Prices tend to revert to the middle band after touching an outer band. This can be used for counter-trend entries in ranging markets, but in trending markets, it can serve as a target or a signal of a temporary pullback.
- Applications:
- Trend Confirmation: Riding the bands confirms the strength of a trend.
- Volatility Measurement: Wide bands indicate high volatility, narrow bands indicate low volatility.
- Entry/Exit Signals: Breakouts from squeezes or reversals from the outer bands can provide trading opportunities.
Keltner Channels
Similar to Bollinger Bands, Keltner Channels also use a moving average as a centerline, but they use the Average True Range (ATR) to set the width of the channels, rather than standard deviation. This makes them less prone to false signals during extreme price spikes.
- Calculation:
- Middle Line: N-period Exponential Moving Average (EMA)
- Upper Channel: N-period EMA + (ATR * Multiplier)
- Lower Channel: N-period EMA – (ATR * Multiplier)
- Interpretation:
- Breakouts: Price breaking out of the Keltner Channels can signal strong trend initiation or acceleration. A close above the upper channel suggests bullish momentum, while a close below the lower channel suggests bearish momentum.
- Trend Confirmation: Prices consistently staying above the middle line and testing the upper channel confirms an uptrend.
- Support and Resistance: The channel lines often act as dynamic support and resistance.
- Applications:
- Trend Identification: Clear breakouts are excellent for identifying strong trends.
- Entry/Exit Points: Can be used to set stop-loss orders or profit targets.
- Less Whipsaw: Due to using ATR, Keltner Channels can be less susceptible to whipsaws than Bollinger Bands in certain market conditions.
Volume-Based Indicators: Validating Trend Momentum
Volume is often considered the “fuel” behind price movements. High volume accompanying a price move suggests stronger conviction and a higher probability of trend continuation, while low volume can signal a lack of interest or potential exhaustion.
On-Balance Volume (OBV)
OBV is a cumulative momentum indicator that relates volume to price change. It shows whether institutional money is flowing into or out of a security.
- Calculation: If the closing price is higher than the previous close, the current day’s volume is added to the previous OBV. If the closing price is lower, the current day’s volume is subtracted. If the price is unchanged, OBV remains the same.
- Interpretation:
- Trend Confirmation: OBV moving in the same direction as the price confirms the trend. Rising OBV with rising prices confirms an uptrend. Falling OBV with falling prices confirms a downtrend.
- Divergence:
- Bullish Divergence: Price makes lower lows, but OBV makes higher lows (potential reversal to the upside due to accumulation).
- Bearish Divergence: Price makes higher highs, but OBV makes lower highs (potential reversal to the downside due to distribution).
- Applications:
- Early Warning of Reversals: Divergence between OBV and price can be a powerful early signal of a trend change.
- Confirmation of Breakouts: A price breakout accompanied by a strong increase in OBV adds credibility to the move.
- Identifying Accumulation/Distribution: Rising OBV during sideways price action might indicate accumulation, while falling OBV could indicate distribution.
Volume Price Trend (VPT)
The VPT indicator is similar to OBV but also considers the percentage change in price, making it a more sensitive measure of money flow.
- Calculation: Current VPT = Previous VPT + (Current Volume * ((Current Close – Previous Close) / Previous Close))
- Interpretation:
- Trend Confirmation: Rising VPT confirms an uptrend, as positive price changes are accompanied by volume. Falling VPT confirms a downtrend.
- Divergence: Similar to OBV, divergence between VPT and price can signal potential reversals.
- Applications:
- More Responsive than OBV: Due to incorporating price percentage change, VPT can sometimes provide earlier signals.
- Confirmation of Breakouts and Reversals: Effective when used in conjunction with price action and other indicators.
Constructing a Robust Trend Following Strategy
No single indicator is a magic bullet. The power of trend following lies in combining these tools to create a comprehensive and robust trading strategy. Here’s how to approach it:
Multi-Timeframe Analysis
Always look at the bigger picture. A stock might be in a short-term downtrend on a 1-hour chart, but in a strong long-term uptrend on a daily or weekly chart. Aligning your trades with the dominant trend of a higher timeframe significantly increases your probability of success. For instance, only take long positions if the daily chart shows an uptrend, even if your entry signal comes from a 15-minute chart.
Confirmation is Key
Never rely on a single indicator’s signal. Seek confirmation from multiple, complementary indicators. For example, a bullish moving average crossover is stronger when accompanied by a rising ADX above 25 and increasing OBV. This triangulation of signals reduces false positives and improves signal reliability.
Risk Management and Position Sizing
Even with the best indicators, losses are an inevitable part of trading. Implement strict risk management rules:
- Stop-Loss Orders: Always define your maximum acceptable loss before entering a trade. Use volatility-based indicators like ATR to set intelligent stop-loss levels.
- Position Sizing: Never risk more than a small percentage (e.g., 1-2%) of your total capital on any single trade.
- Take-Profit Levels: While trend followers aim to ride trends, having partial take-profit levels can help secure profits during extended moves. Trailing stops are also excellent for trend following.
Backtesting and Forward Testing
Before deploying any trend following strategy with real capital, rigorously backtest it on historical data. This helps you understand its performance characteristics, drawdown potential, and profitability across different market conditions. Once backtested, forward test the strategy in a demo account with live data to ensure its viability in real-time.
Adaptability and Continuous Learning
Markets are constantly evolving. A trend following strategy that works well today might require adjustments tomorrow. Stay informed about market dynamics, continuously analyze your performance, and be willing to adapt your approach as needed. The best traders are perpetual learners.
In conclusion, trend following indicators are powerful tools for navigating the financial markets. By understanding their mechanics, interpreting their signals effectively, and combining them into a well-defined strategy with robust risk management, traders can significantly enhance their ability to identify and capitalize on market trends. Remember, patience, discipline, and a commitment to continuous learning are the ultimate indicators of success in the world of trading.

