Hi — I’m Aditya from Rocketalgo Official. In this market recap I’ll walk you through today’s live trading session, the trades we captured, and the framework I use for reading momentum across markets. This post distills everything I discussed in the live quick session on 18th August 2025 and explains why certain moves happened (and why some news didn’t move markets). Whether you trade intraday or study the market structure, you’ll get practical takeaways you can apply immediately in trading, stock market, NSE, BSE, Nifty analysis and execution.
SEO note: Throughout this article I’ll reference key concepts for trading, stock market, NSE, BSE, Nifty so you can find practical strategies, examples, and market reasoning that matter in real time.
Table of Contents
- 📈 Market snapshot — what we saw today
- 🧭 Why Nifty moves the way it does — ignore the noise
- 🔍 Midcap versus Nifty — today’s trades and why they behaved differently
- 💷 Gold and big surprise overnight moves
- ⛽ Crude oil — timing matters, and position sizing rules
- 🧠 Trading framework I used today — A, B, C explained
- 🔗 Crypto (Ethereum) — how we treat it vs traditional markets
- 🕒 Live session realities — connectivity, timezones, and practical tips
- 📊 Trade management and exit behavior — what happens at market close
- 📌 Practical checklist before taking any trade
- 📉 Why some news doesn’t move the market — real examples
- 📚 Education and continuing improvement — how to level up
- 🔁 Wrap-up: What I want you to remember
- ❓ Frequently Asked Questions (FAQ)
- 📎 Resources and next steps
- 📷 More screenshots from the session
- ⚠️ Final notes and risk reminder
📈 Market snapshot — what we saw today
Today’s market presented clean momentum across multiple assets. Early in the session we opened a midcap trade that turned into a nice momentum capture. Nifty also produced a very satisfying intraday run — the kind of move that validates the way we read market structure and top-stock contributions.
Important practical points from today:
- Midcap trades can produce sharp, single-shot momentum moves — treat them like quick, high-risk opportunities.
- Nifty movement is driven by the top-50 constituents — think Reliance, HDFC, Infosys, TCS, and others — not by the index itself or by options volume myths.
- Macro headlines often create chatter but not always market action. For example, the Trump–Putin mention during today’s session created social buzz but no material market impact.
We’ll unpack each of these observations below and show the actionable rules I used to trade each instrument — including crude, gold, and Ethereum.
🧭 Why Nifty moves the way it does — ignore the noise
One frequent misunderstanding I clear up in sessions is the idea that Nifty’s momentum is somehow driven primarily by “index volume” or by options-only plays. That’s not true in practical terms. Nifty’s movement depends on the underlying stocks — the 50 companies that form the Nifty 50 basket.
When someone says “Nifty volume is drying up” or “index volume will stop the move,” remember this: the index reflects aggregated price action of its components. If Reliance or HDFC or Tata moves with high volume, Nifty will move regardless of headline about index-level volumes.
So the right operational mindset for trading the index is:
- Watch the top contributors (Reliance, HDFC, ICICI, Infosys, etc.).
- Map their momentum into index inference — if several top-10 names run together, index momentum is confirmed.
- Ignore blanket statements that assume index-level metrics alone drive price — they rarely give you timely trading edges.
In short: Nifty is a derivative of its constituents. Use that knowledge to interpret moves and trade more intelligently in the trading, stock market, NSE, BSE, Nifty environment.
🔍 Midcap versus Nifty — today’s trades and why they behaved differently
Midcap is where you can see sharp, “shock” style moves: a quick angle followed by breakout and strong candle momentum. Today we took a midcap angle which later broke out and produced a clean trade thanks to:
- Defined angle (A for angle) — clear slope showing building interest.
- Breakout confirmation (B for breakout) — price closing beyond the angle zone with momentum.
- Candle + Money Flow confirmation (C for candle/money flow) — the candle structure and money inflow validated the move.
This A-B-C rule set is part of the Rocketalgo trading playbook we discussed live. It helps avoid entering when a move is ambiguous. Compared to midcap, Nifty had sustained momentum that was easier to follow because multiple top names participated. So while midcap gave a high-volatility single-shot opportunity, Nifty provided a more steady, wider-movement trade.
💷 Gold and big surprise overnight moves
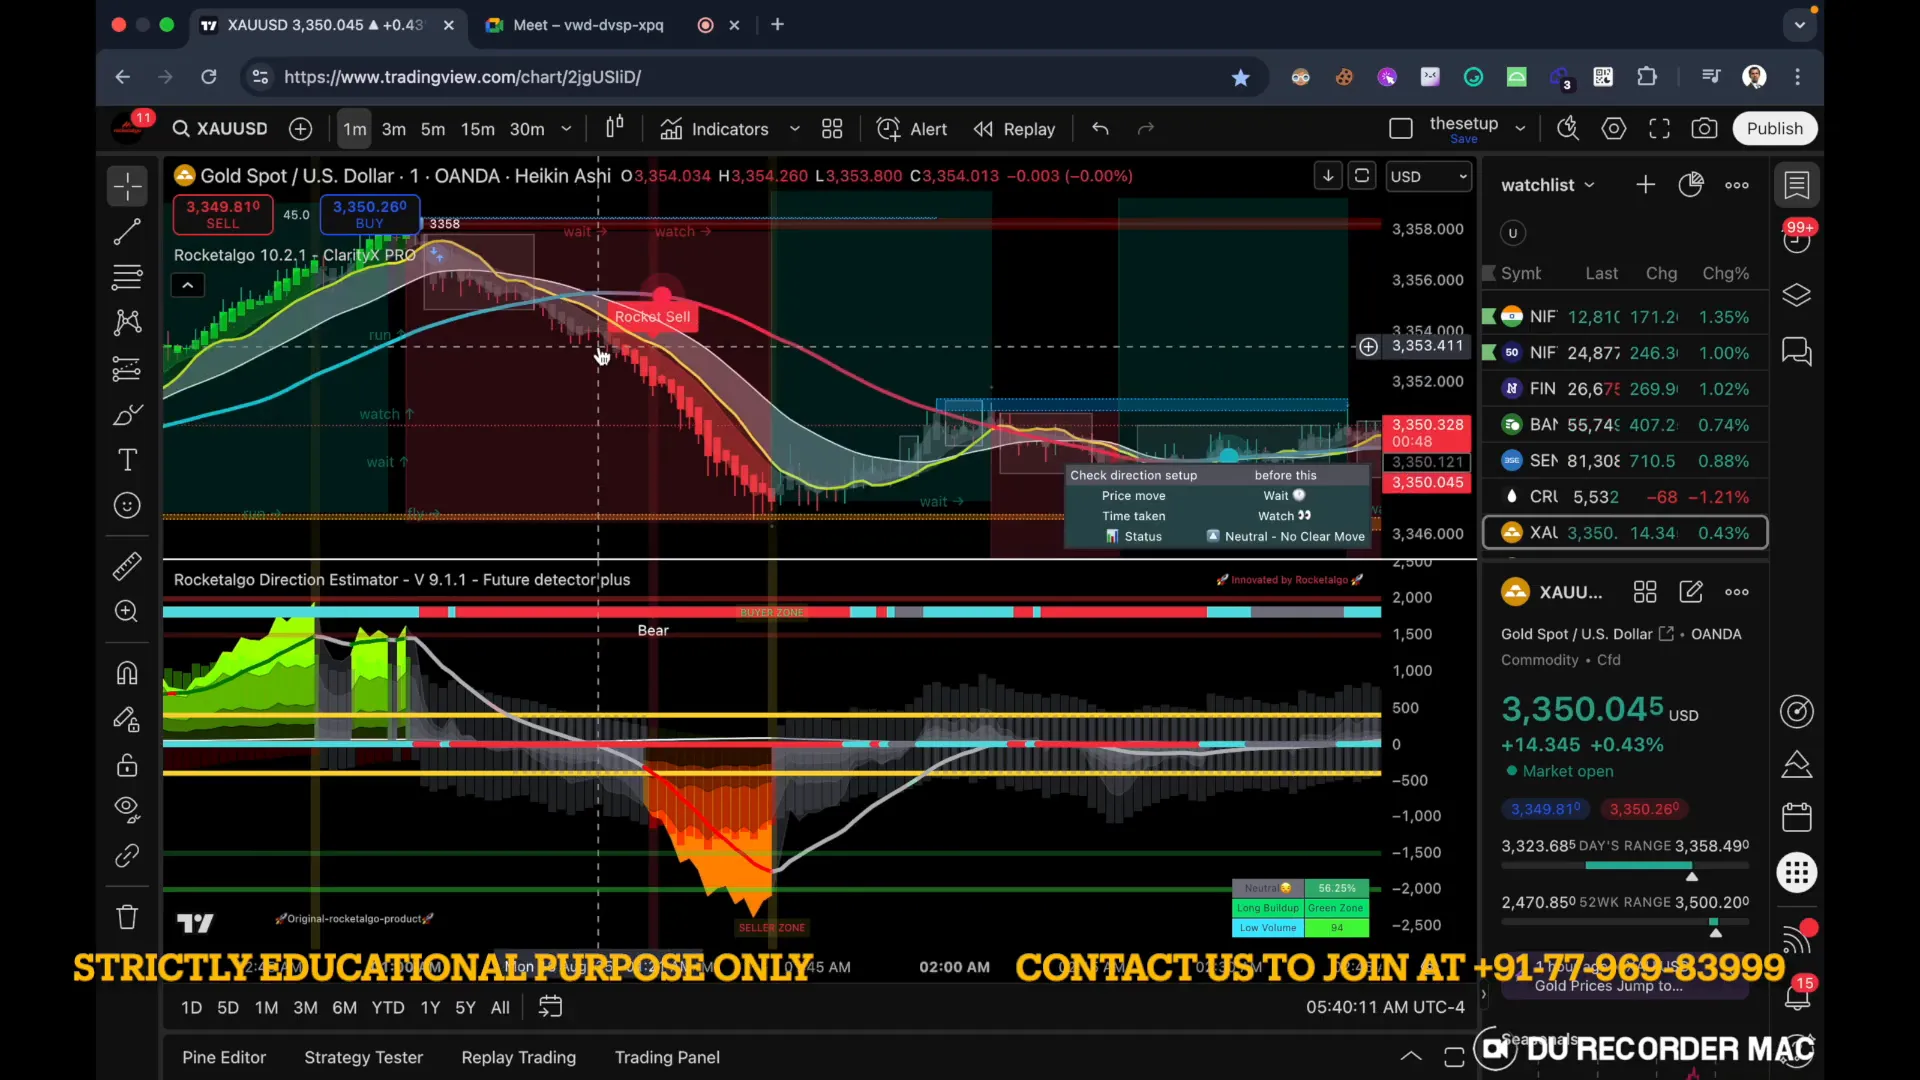
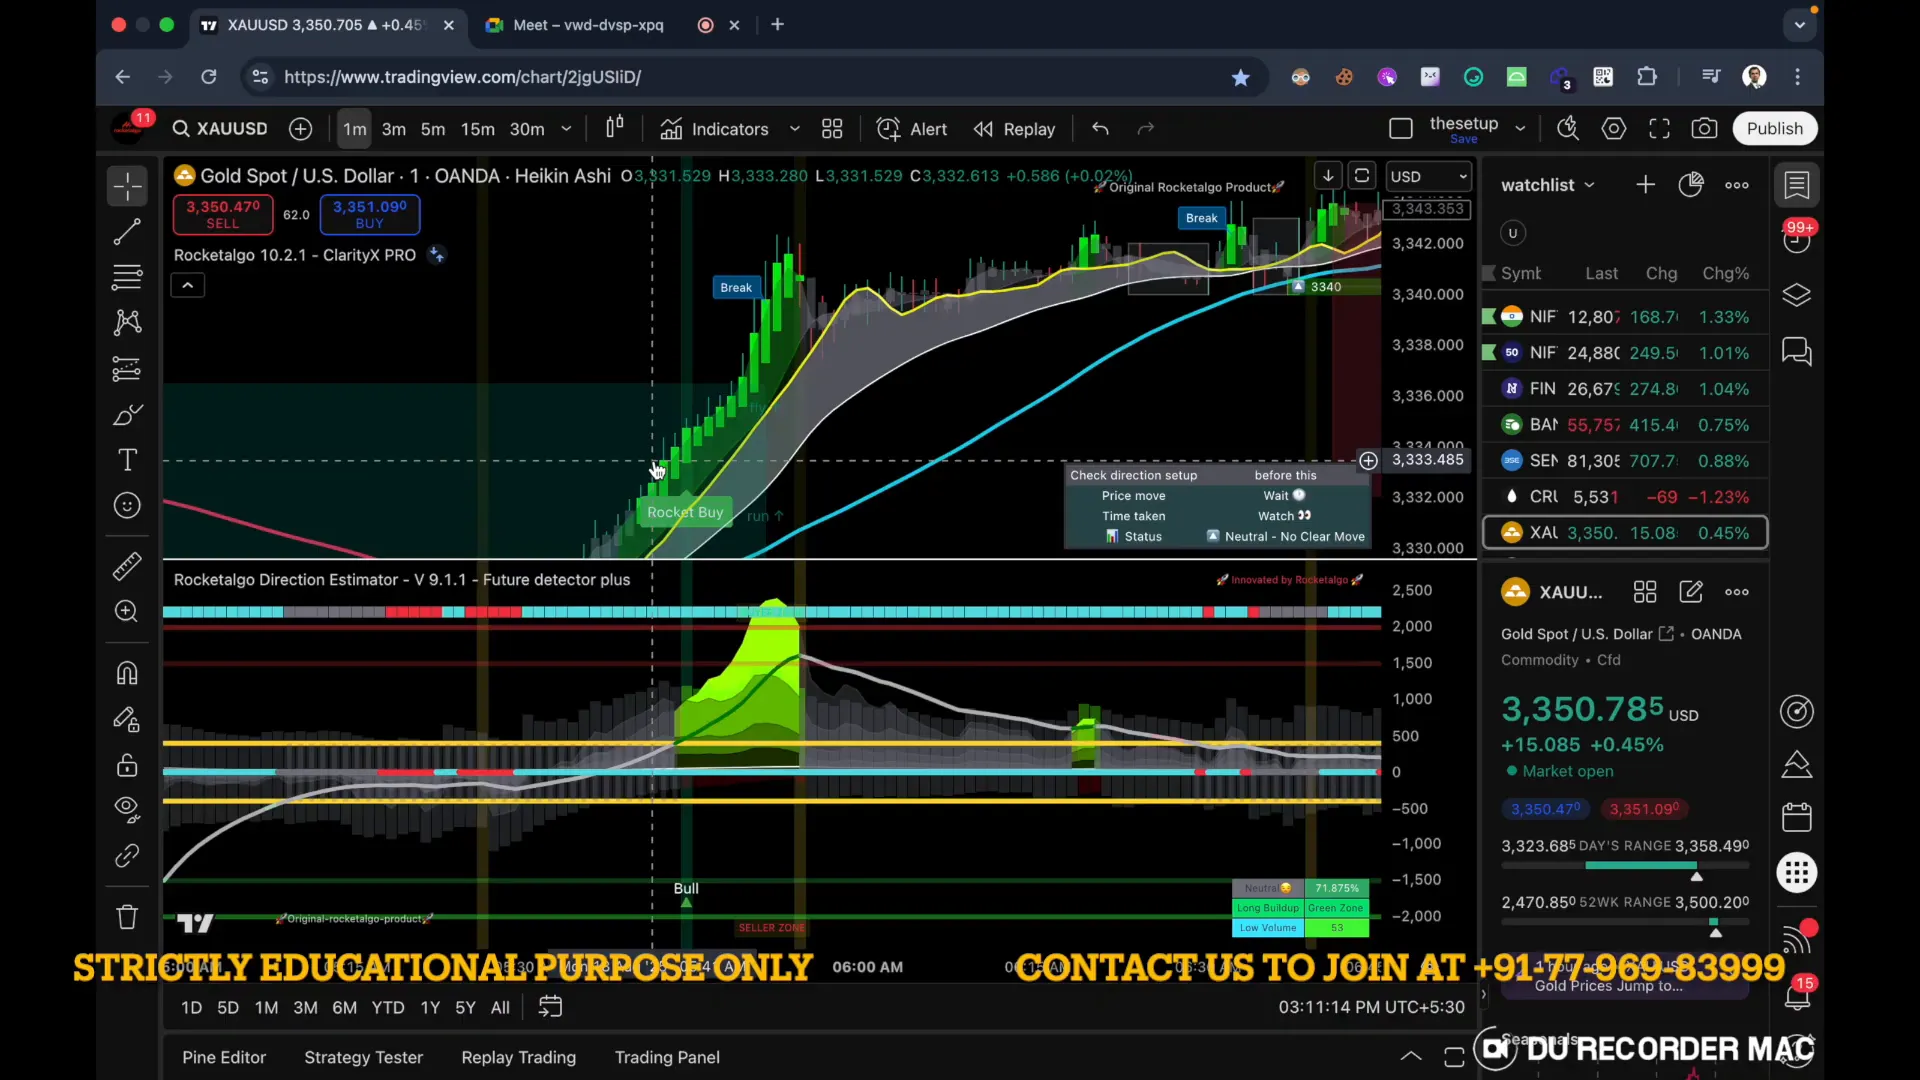
Gold produced an unexpectedly large momentum swing — a move that surprised even me. We caught a late-night (or early-morning in Indian time) gold trade where price moved several dollars in a single impulsive leg. This is an important reminder: liquidity and momentum can ignite outside Indian market hours and still affect risk positions during local sessions.

What to learn here:
- Don’t ignore overnight moves. They set the bias for the next session.
- Have rules to participate: if angle + breakout + candle/money flow confirms, consider taking the trade even if it’s outside usual hours.
- Size appropriately — overnight momentum can be sharp and causes slippage if oversized.
⛽ Crude oil — timing matters, and position sizing rules
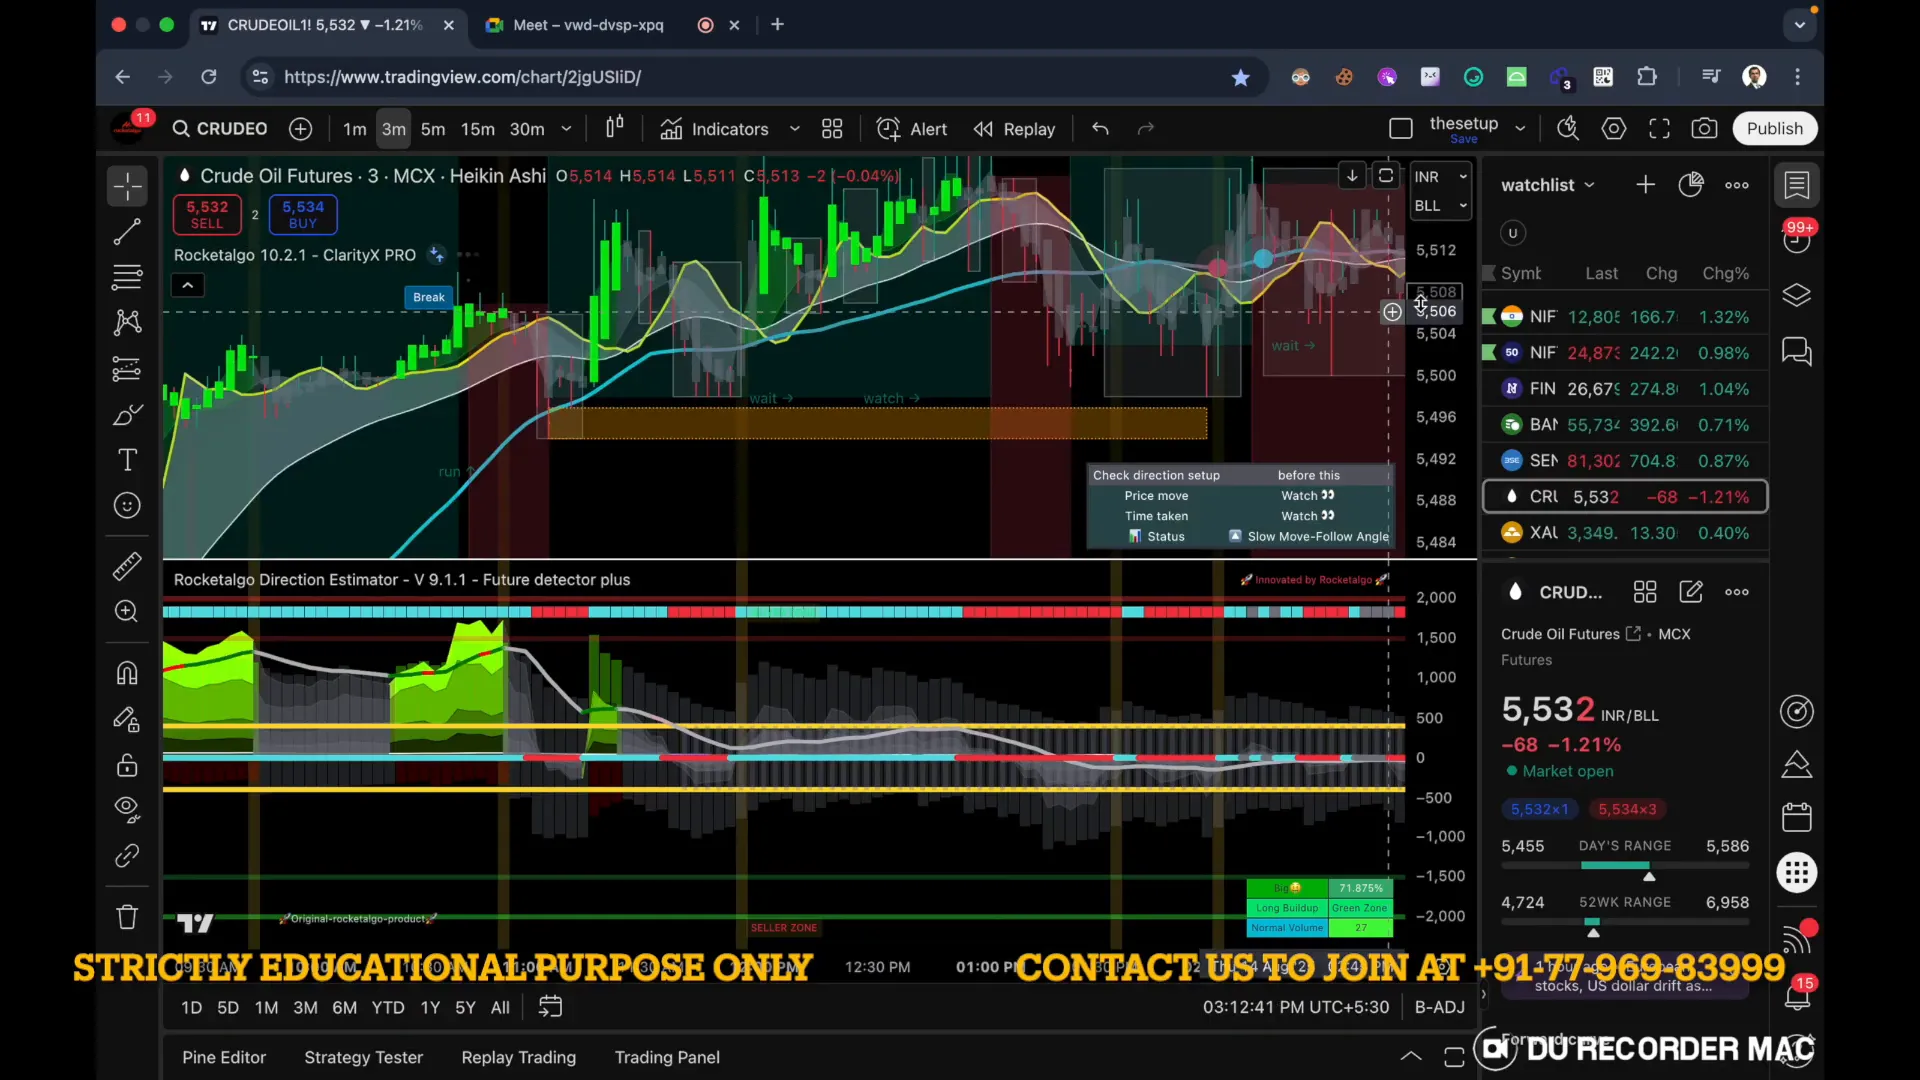
We discussed crude oil in response to a user request. For crude I typically use a 3-minute timeframe to capture small swings. Today we tracked a level around 5,500 (in the instrument scale I referenced live) and explained a simple risk-reward fact: a one rupee move in that contract can be ~Rs.100 in P&L depending on contract size.

Concrete takeaways for crude:
- Use shorter timeframes (3-min) for intraday crude opportunities.
- Know per-tick/per-rupee contract exposure — it determines position size and stop-loss placement.
- Angle-first entry is effective: you can get entries based on angle even before a textual breakout appears — rare but valid when other confirmations align.
🧠 Trading framework I used today — A, B, C explained
This was repeated in today’s session multiple times because it’s the core of how we pick valid trades. The rule is simple and repeatable:
- A — Angle: A visible slope or directional bias on the timeframe you trade. It’s the structural hint that momentum may follow.
- B — Breakout: Ideally the breakout validates the angle: price closes beyond the angle resistance/support.
- C — Candle & Money Flow: Look for candle perfection (clear momentum candle, no long tails opposing) and money flow percentage to support conviction.
We call this the “A for angle, B for breakout, C for candle/moneyflow” framework. If all three align, probability is higher. If only one aligns, be cautious. This worked across midcap, Nifty, gold, crude, and even Ethereum today.
🔗 Crypto (Ethereum) — how we treat it vs traditional markets
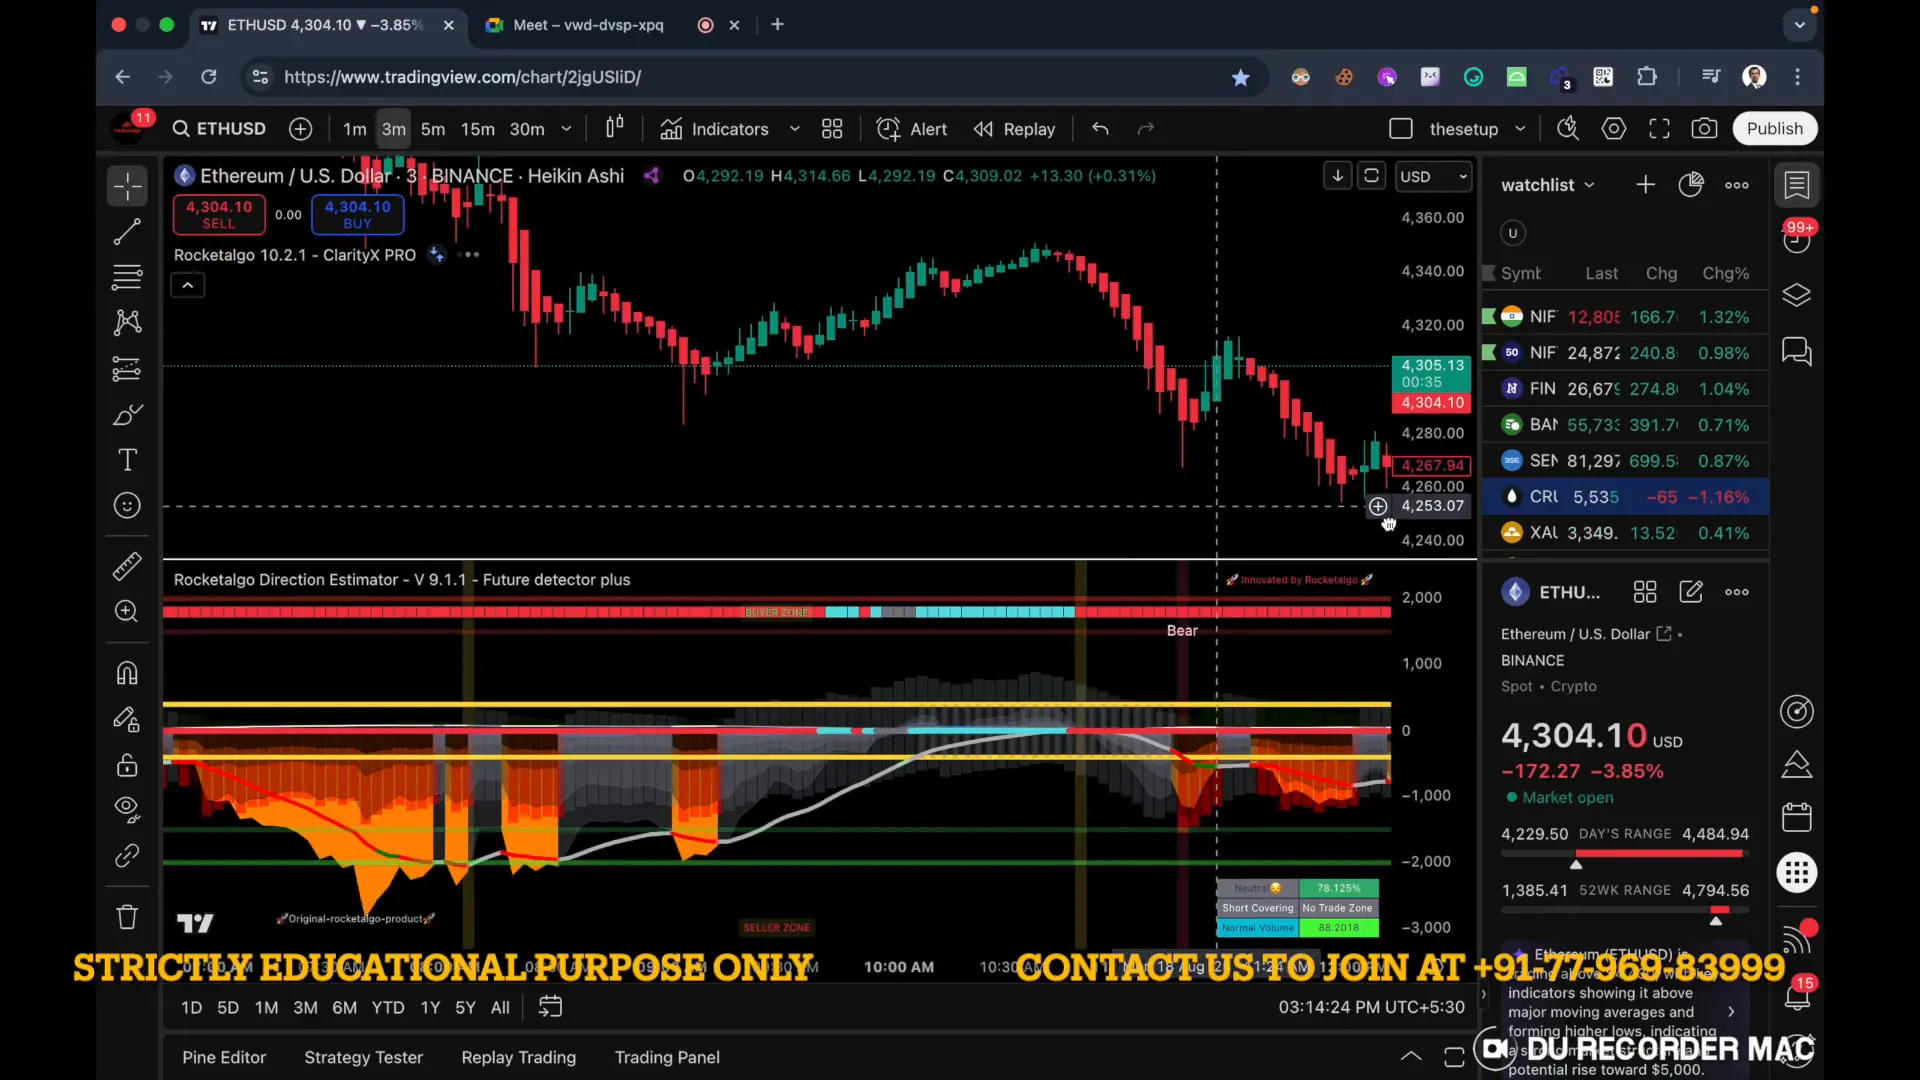
Yes, we trade crypto too. Today we reviewed Ethereum (ETH/USD) on Binance. The same A-B-C framework applies, but with a few caveats:
- Crypto trades 24/7 — volatility clusters can appear at odd hours; overnight biases matter more.
- Liquidity differs by exchange. I often use Binance due to liquidity and tight spreads.
- Gaps and sudden directional moves can happen because of global macro or exchange-specific flows — so use smaller sizes compared to equities.

We captured an ETH move after a breakout that followed a clean angle and candle confirmation. The Rocketalgo rules don’t change — they just adapt to the asset’s volatility and session timing.
🕒 Live session realities — connectivity, timezones, and practical tips
During the live session I joined from a laptop while traveling and faced a Mumbai network issue due to rain. Two important practical reminders here:
- Always have a contingency (phone hotspot, backup data plan) if you trade live or host sessions.
- Be careful with timestamps and timezones. I demonstrated earlier how UTC offsets matter when checking historical trades — confirm the exchange timezone to properly log your trades.
Time-zone mismatch can lead to confusion about when moves actually happened. Use consistent timezone settings in your charting or broker platform (I prefer UTC+5:30 for Indian market context) to avoid mistakes when analyzing overnight or early-morning trades.
📊 Trade management and exit behavior — what happens at market close
One short but crucial lesson: in the technical trading world, many traders focus on exiting positions near market close rather than holding through end-of-day. Why?
- Closing auctions and end-of-day order imbalances can cause erratic moves.
- Liquidity often thins near close, increasing slippage and stop-hunting risk.
- For intraday strategies, locking in profits before close typically reduces overnight risk and preserves capital.
This behavioral dynamic means you should PX (plan exits) in advance: if you get your target, exit; if partials are used, trail stops or scale out. For swing or positional traders, different rules apply — but for intraday and the types of trades we discussed (midcap, Nifty intraday, crude 3-min), an emphasis on exit discipline wins consistently.
📌 Practical checklist before taking any trade
Here’s the checklist I used repeatedly in the session — keep it front of mind before pressing buy or sell:
- Confirm angle (A) on your preferred timeframe.
- Wait for breakout (B) or clear reason to enter on angle-confirmation.
- Validate with candle structure & money flow (C).
- Know per-tick contract exposure (especially for crude and futures).
- Define stop loss and target; size position accordingly.
- Plan exit if close approaches or if market structure reverses.
📉 Why some news doesn’t move the market — real examples
During the session we saw a user ask about a Trump–Putin mention trending on WhatsApp and news channels. The blunt answer: it didn’t move the markets materially.
Why? Because talk is not the same as action. News channels often run speculative possibilities (“they might do this or that”), but unless there is concrete action (policy change, sanctions, supply disruptions, central bank statements), the market typically discounts it. Today’s reaction showed chatter but no directional flow with conviction across major instruments.
Rule of thumb: differentiate between rumor/news and event. Only a sequence of confirmed events with market impact (sanctions, supply halts, major central bank changes) typically changes sustained momentum.
📚 Education and continuing improvement — how to level up
If you want to internalize what we discussed, here’s a simple study plan:
- Replay charts and mark each trade you took or observed. Label angle, breakout, candle, and money flow each time.
- Keep a trade journal — note why you entered and exited, and what confirmed the move.
- Review overnight sessions for gold, crude, and crypto — annotate biases that carried into your local session.
- Practice position sizing with a simulated account until you can exit without emotional mistakes.
We also offer guides and a learning portal that expand on these concepts if you wish structured training. But you can get a long way by using the A-B-C framework and consistent journaling.
🔁 Wrap-up: What I want you to remember
Here are the three one-sentence principles to take away:
- Nifty is moved by its top constituents, not by index-level myth — watch the 50 stocks.
- Use the angle-breakout-candle (A-B-C) rule for higher-probability trades across markets (equity, commodities, crypto).
- Manage exits and size; market noise (headlines) rarely replaces confirmed price structure.
If you apply those consistently in trading, stock market, NSE, BSE, Nifty contexts, your entries will be cleaner and your risk better managed.
❓ Frequently Asked Questions (FAQ)
Q1: How do I interpret Nifty moves during low options volume?
A1: Ignore the headline. Instead, look at the underlying top 50 stocks. If several heavyweight stocks show momentum and volume, Nifty will follow. Always base index decisions on constituent action rather than options chatter.
Q2: Which timeframe should I use for crude and why?
A2: For intraday crude I use 3-minute charts — they capture micro-structure moves and let you react quickly to angle + breakout. But always size for the contract’s per-rupee exposure.
Q3: Can the same A-B-C framework be applied to crypto?
A3: Yes. Use the same rules but smaller sizes, and be mindful of global sessions and gaps. On Binance or other liquidity-dense exchanges, the framework works because it’s a pattern-recognition method based on price structure.
Q4: What if I miss the breakout — is there still a way to trade?
A4: Yes. Wait for a retracement back to the angle or a microstructure pullback with new confirmation (e.g., smaller timeframe candle confirmation). Don’t chase with oversized position size.
Q5: How important is the close-of-day behavior?
A5: Very. Many intraday exits happen near close. Reduced liquidity and end-of-day balancing create noise; plan your exit to avoid being caught by EOD anomalies unless you intend to hold overnight with a clear thesis.
📎 Resources and next steps
If you found today’s breakdown useful, here are practical steps you can take now:
- Replay your charts and label patterns using the A-B-C checklist.
- Practice one instrument for a week — e.g., Nifty futures — and note how many trades meet all three criteria.
- Study top constituent movement to better anticipate Nifty behavior.
For deeper learning, Rocketalgo provides training resources that expand on angle identification, breakout management, and money-flow reading. If you want to continue, consider our guides and learning portal where we build these skills step-by-step.
📷 More screenshots from the session
Below are additional snapshots from specific moments discussed:

⚠️ Final notes and risk reminder
Trading carries risk. Nothing in this post is financial advice — it’s an educational discussion of how I read markets. Use proper risk management, paper trade the methods, and consult a licensed advisor if you need tailored guidance. As I said in the session, past performance doesn’t guarantee future returns; always respect the market and your capital.
Thanks for reading. If you found this helpful, replay the session, mark the trades, and integrate the A-B-C rule into your daily routine. I’ll keep sharing practical, live-market lessons — see you in the next session.
Keywords for this article: trading, stock market, NSE, BSE, Nifty — use them to search for similar lessons in our learning portal and practice sessions.
trading, stock market, NSE, BSE, Nifty trading, stock market, NSE, BSE, Nifty trading, stock market, NSE, BSE, Nifty trading, stock market, NSE, BSE, Nifty trading, stock market, NSE, BSE, Nifty trading, stock market, NSE, BSE, Nifty trading, stock market, NSE, BSE, Nifty
Need more help |
|
Contact us by clicking the button below |
|
Click me |


