


Table of Contents
- 📣 Introduction — Why I recorded this session and what you’ll learn
- 🔍 Outline — What we’ll cover in this article
- 📈 The dominance concept — “Ammani and the 40–50 vehicles”
- 📐 Angle + Volume Profiling — Why both matter (and why neither alone is perfect)
- ⏳ Time vs Price — Why things sometimes “feel” slow
- 🤖 Targets and AI — How our TradingView indicator calculates realistic targets
- 🎯 Resistance, Profit Booking, and Trailing Stop Loss
- 💸 Trade sizes, costs, and why small lots matter
- 🧭 Live examples and quotes from the session
- 📚 Education, paid courses, and expectations
- 🔧 Operational & support details
- 📌 Practical checklist — What to do before placing a trade
- 🧠 Mindset and etiquette reminders
- ❓ Frequently Asked Questions (FAQ) — Quick answers to what people asked
- 🔁 Common scenarios and how to respond
- 🧾 Closing thoughts — What I want you to remember
- 📞 How to connect
- ✅ Final checklist before you trade
- 📘 Extra resources and recommended next steps
- 📝 FAQ Recap — Quick reference
- 🙌 Thank you — see you in the next session
📣 Introduction — Why I recorded this session and what you’ll learn
Hello — I’m Rocketalgo Official, and in this post I’ll walk you through the ideas, examples, and practical lessons I covered in our live session on 1st Sept 2025. If you care about trading, stock market, NSE, BSE, Nifty — this piece is written to be a simple, no-fluff guide that translates the live commentary into actionable takeaways.
I recorded the session to explain a few recurring themes I see every day: dominance in price action, how angle and volume profiling interact, why targets sometimes feel unrealistic, how our AI-based target calculation works, and the practical use of trailing stop loss and resistance levels. Along the way I used a story — the “Ammani and 40–50 vehicles” example — to make dominance easier to remember.
🔍 Outline — What we’ll cover in this article
- How dominance works (the Ammani example) and why it matters for intraday trading
- The role of angle and volume profiling — and why one without the other can mislead you
- Why price sometimes moves fast while time seems to slow down
- How our AI in TradingView calculates targets and why those targets should not be dismissed
- Practical rules: resistance, trailing stop loss, and how to book profits
- Operational items: paid courses, support contact, and best practices
- FAQ covering common questions from the session
📈 The dominance concept — “Ammani and the 40–50 vehicles”
Think of the market as a road between point A (entry) and point B (exit). Normally, a predictable flow of vehicles (traders) travels from A to B. Dominance happens when one very large participant (an institution, a big fund, or a dominant trader — that’s “Ammani” in my example) decides to take a different route and drives a convoy of 40–50 vehicles into the area where retail traders usually operate. Can you stop that convoy? No.
In trading terms: when an institutional-level order enters the market from an unexpected area, it can overwhelm the typical local dynamics. This dominance can temporarily flip the direction of price movement — even if the broader profile or previous trend suggested otherwise.
Why this metaphor matters: once you remember the convoy, you’ll remember that a single dominant participant can cause short-term reversals, exaggerated spikes, or sharp drops. You should always ask: who is moving this much volume, and where will they go next?
Key takeaway
Dominance means large orders that can override typical local market expectations — and it explains many sudden moves that look irrational to retail traders.
📐 Angle + Volume Profiling — Why both matter (and why neither alone is perfect)
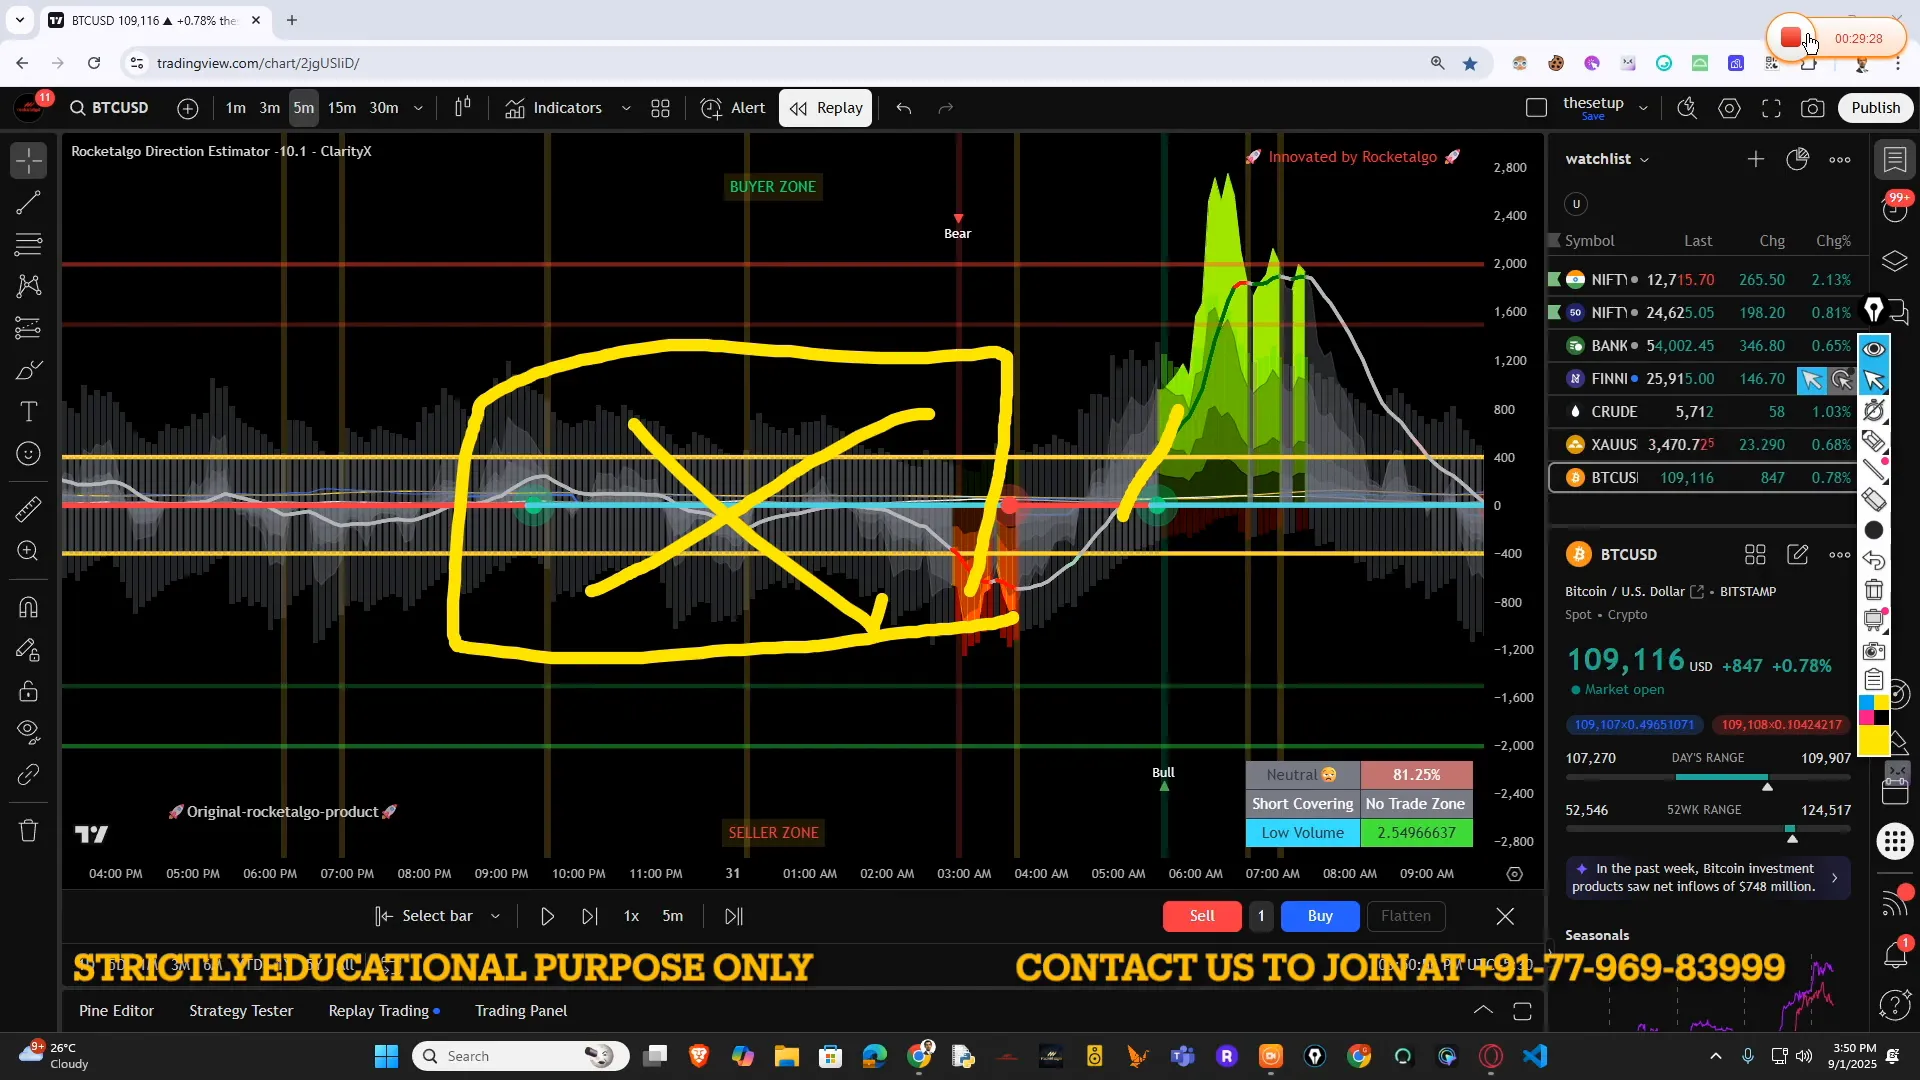
Two pieces of information I repeatedly emphasized: angle and volume profiling. Neither is a magic bullet by itself.
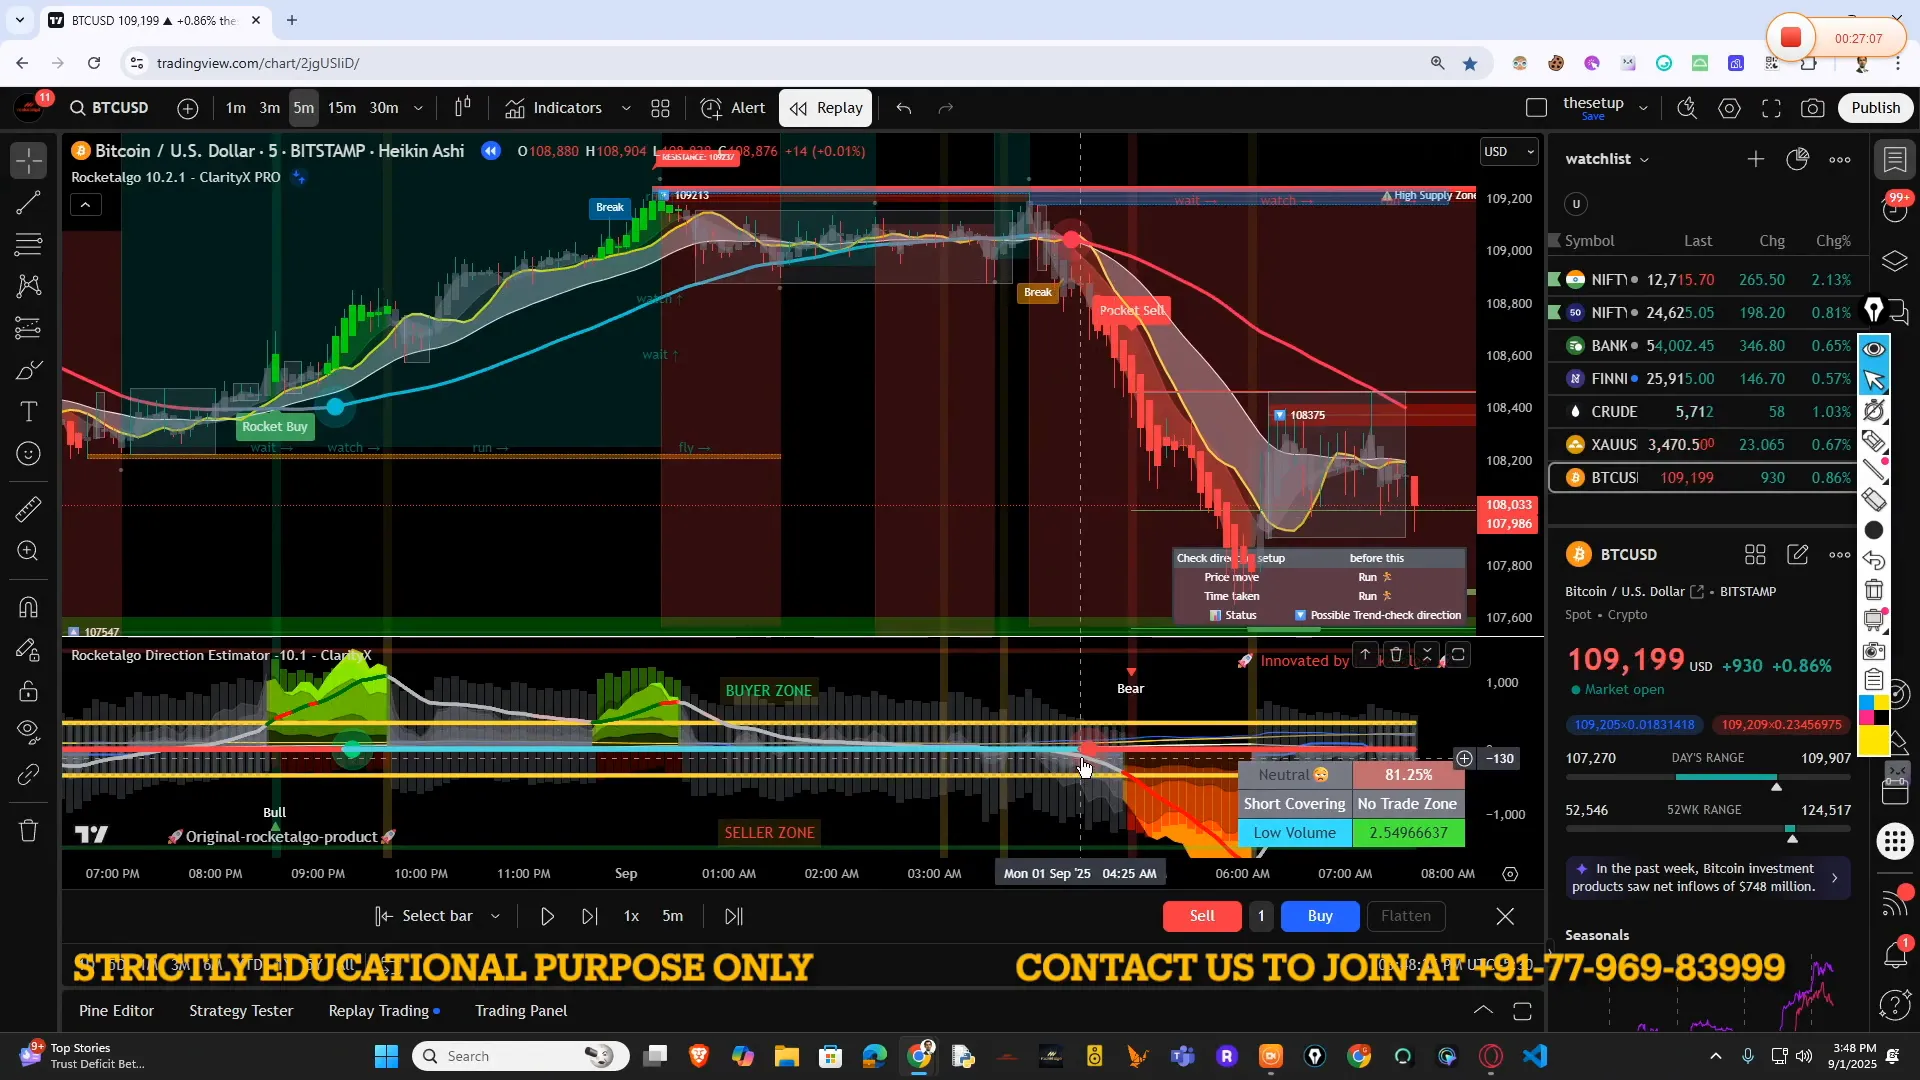
Angle refers to the slope of the price move. When you see a consistent upward angle, it means buyers are dominating over the observed sample. Volume profiling shows where most trading occurred at price levels — the blue zone in my session is the expected buy area.
But what happens when a dominant institution intervenes? The angle may still be pointing up, the blue zone may still show heavy buy interest, yet a large player can decide to drop the price for a while. When that happens, local traders who are long may get shaken out, even though the broader angle remains constructive.
Practical rule
- Use angle to understand momentum direction.
- Use volume profiling to locate high-interest price zones.
- Combine them: when angle and volume profile agree, trade with greater conviction — but remain aware of dominance risk.
Important warning: volume profiling without context can mislead. Volume shows where people traded; it doesn’t guarantee that the trade will be defended by larger players if a dominant participant decides otherwise.
⏳ Time vs Price — Why things sometimes “feel” slow
A question I got multiple times: “Why did the move not ‘go crazy’?” or “Why is the move slow even though price is flying?” The answer lies in the relationship between the pace of price change and the passage of time on the market clock.
Price can spike quickly, but if the market’s time component (the participation rate, willingness of traders to engage over a period) remains low, the move will look sluggish in terms of continuation and momentum. Imagine price jumping but not enough participants following — the rate of follow-through is what makes a move explosive.
In plain terms: if your order size is small (zero point one lot vs zero point five lot vs full lots) and the time-based participation is low, you’ll see limited momentum even in a correct direction.
Practical rule
- Monitor both price velocity and time-based participation indicators.
- If price moves fast but time volume is low, consider reducing target expectations or using tighter trailing stops.
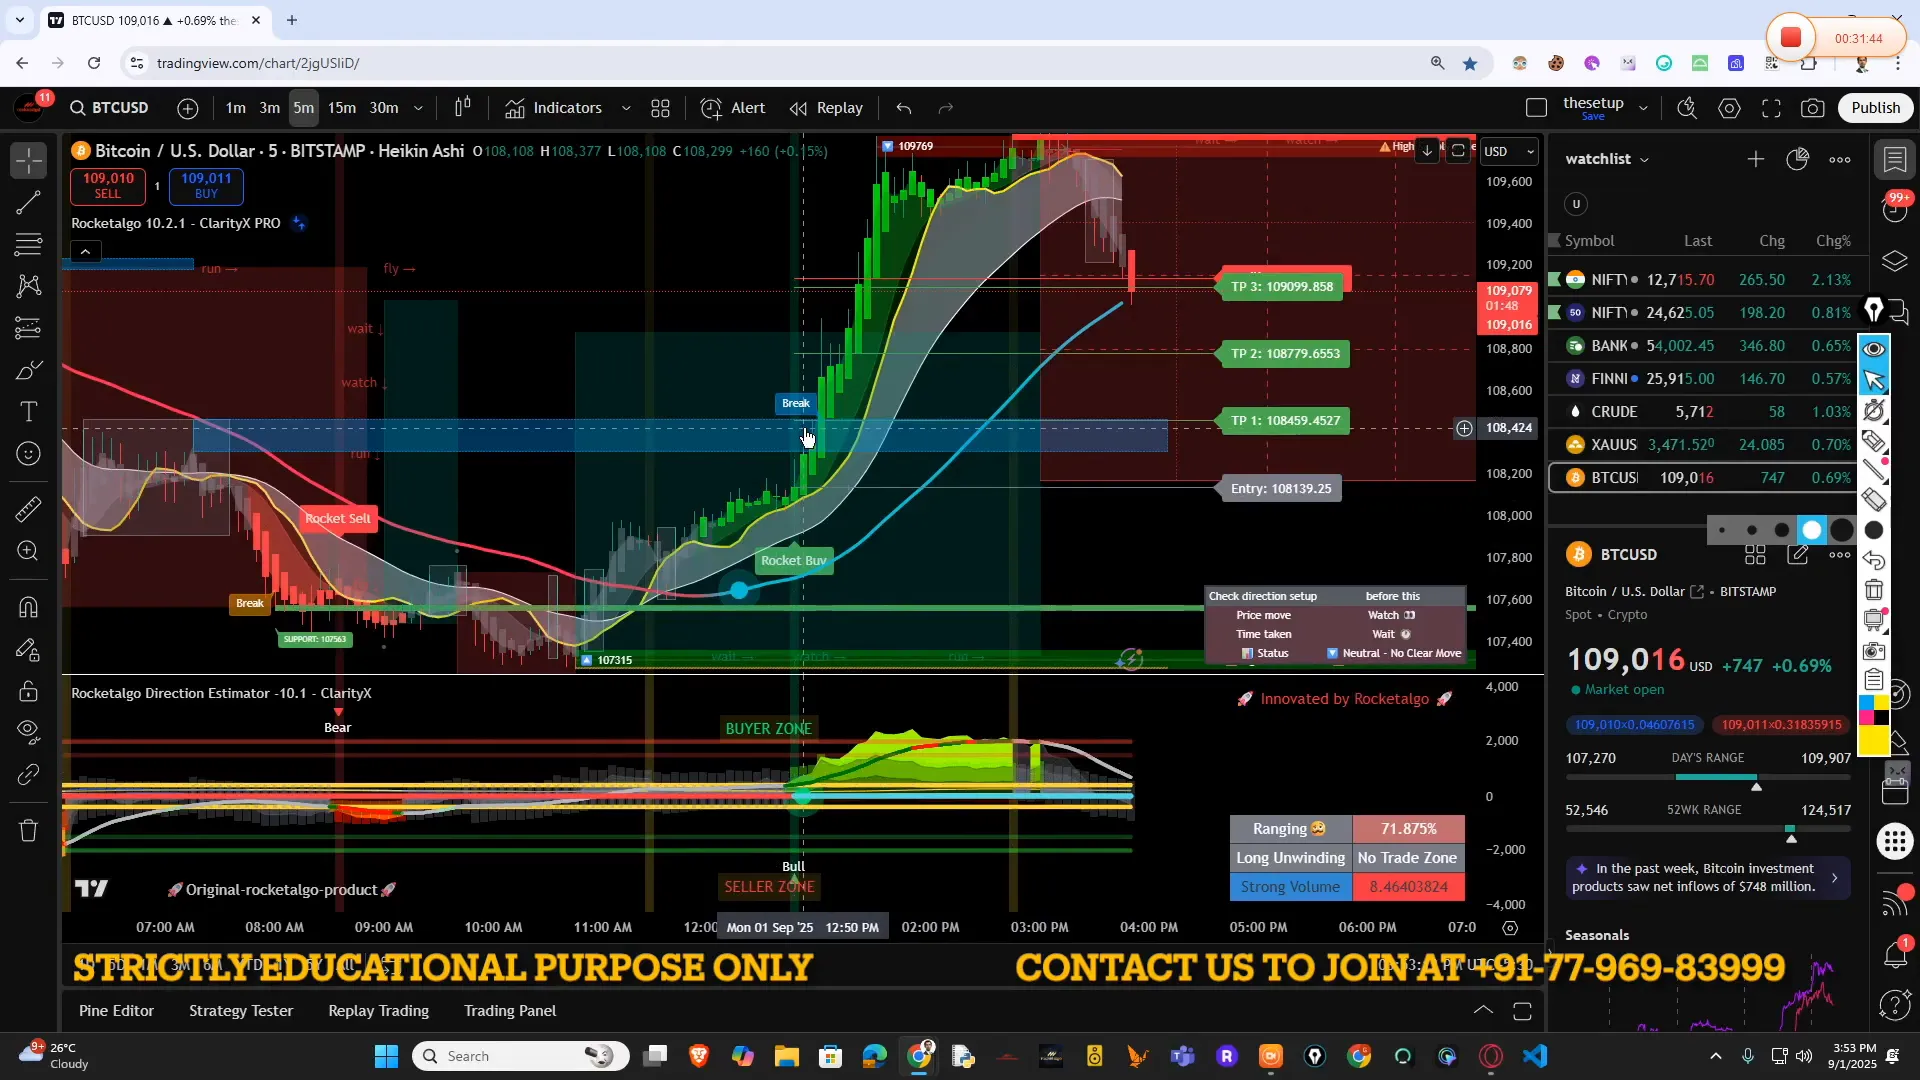
🤖 Targets and AI — How our TradingView indicator calculates realistic targets
We calculate targets using an AI-backed library embedded inside our TradingView indicator. This is not guesswork; the system uses conditional logic, historical patterns, and session-level heuristics to propose probable targets. When people call these targets “unrealistic,” it usually reflects a misunderstanding of how the system interprets market context.
Important: AI gives probabilistic targets, not certainties. Targets are based on market sentiment, the session structure, and our conditional logic. That means sometimes the target will be hit quickly and other times it will take hours or retrace before it reaches the predicted level.
A few practical points about targets:
- Targets are derived from backend calculations — not random numbers. They reflect market structure and AI probability distributions.
- Use targets as a guide, not an absolute rule. Combine them with price action and risk management tactics like trailing stop loss.
- When we publish a target, it might span a range — e.g., 47–71 dollars — which is informed by session volatility and expected movement.
One more clear point: targets depend on market sentiment and the conditional logic encoded in our system. They’re reproducible, auditable, and rooted in data — but they should be used with sensible trade management.
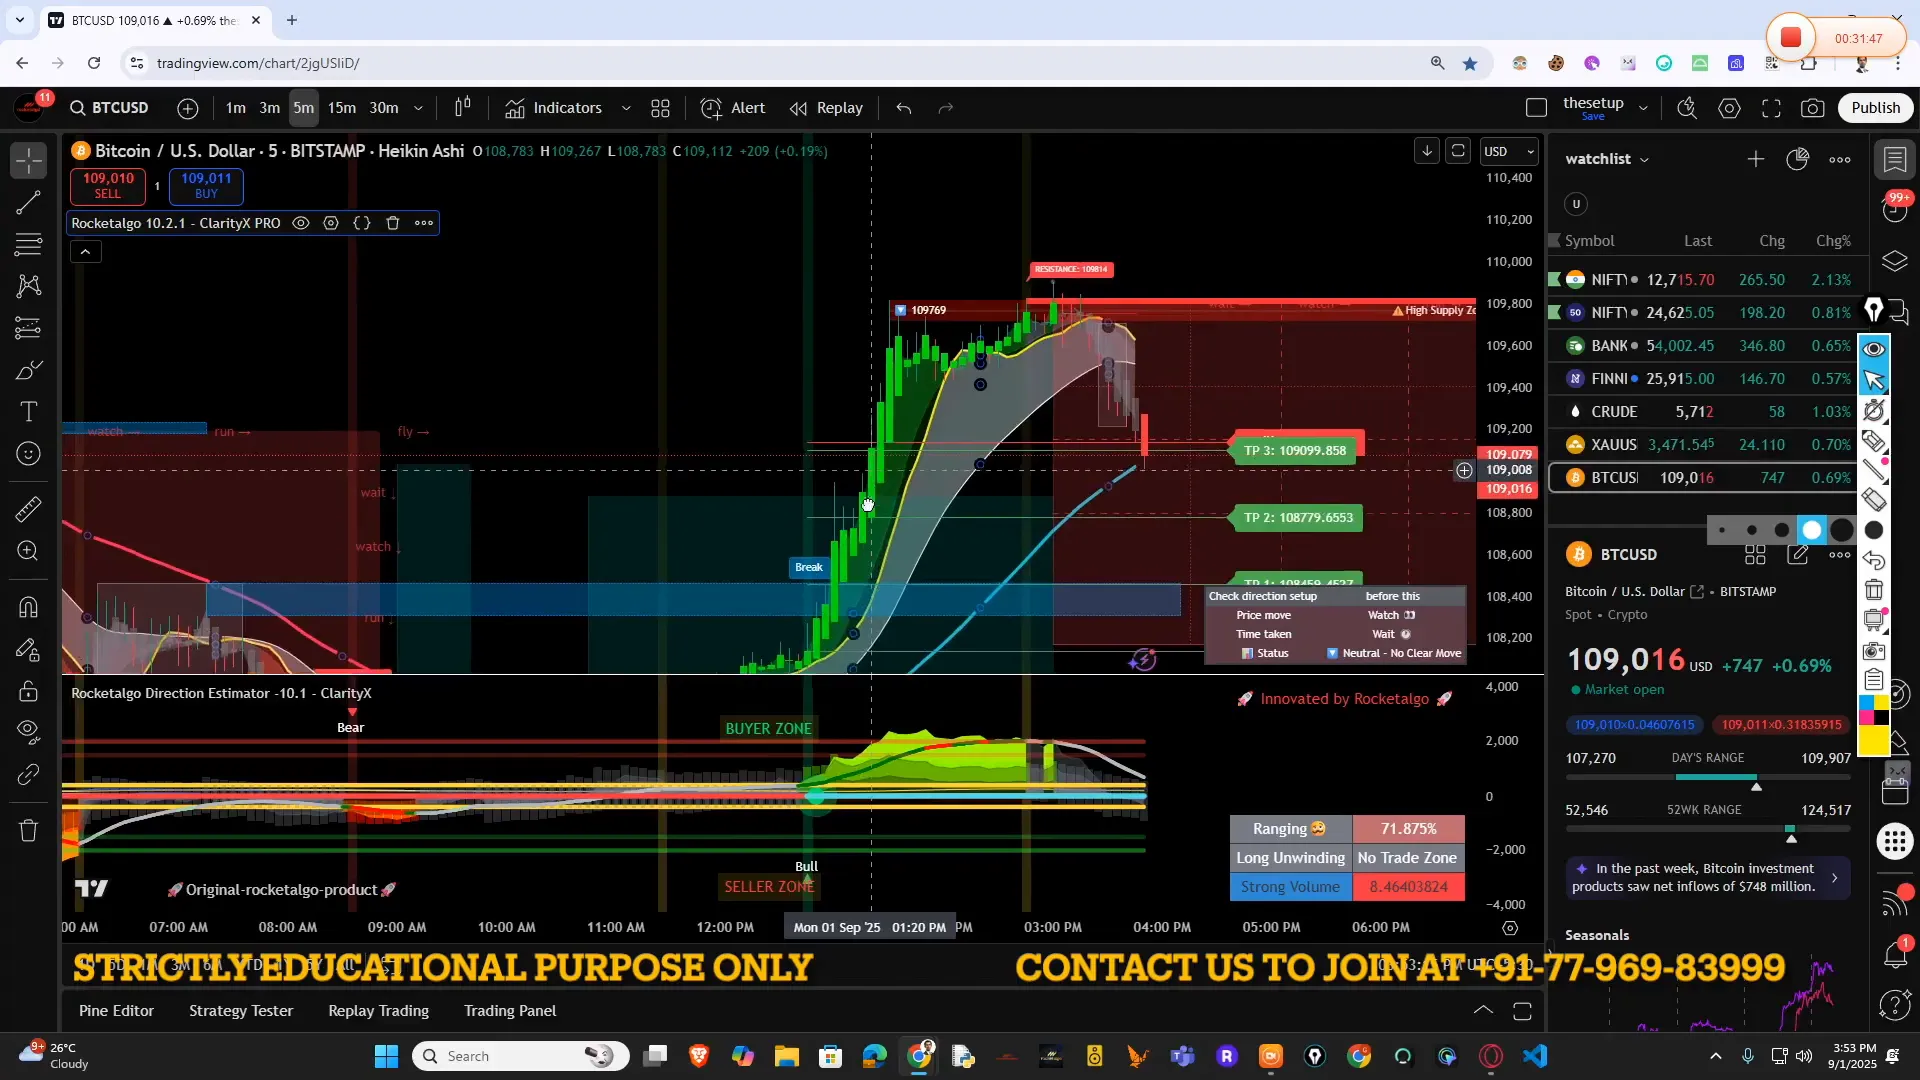
🎯 Resistance, Profit Booking, and Trailing Stop Loss
Resistance levels are places where many traders may book profits or place sell orders. When price hits an obvious resistance, early participants may exit, creating congestion or pullbacks. Book profits do not mean the underlying thesis is wrong; it just means short-term participants realized gains.
My recommendation from the session: always use a trailing stop loss when you are in a position that aims for the AI target. Trailing stops help you lock in gains while giving the trade room to breathe. Practically, you want to:
- Set an initial stop loss based on your risk tolerance.
- Use a trailing stop to protect profits as the trade moves in your favor.
- Adjust trailing stop distance based on volatility and instrument specifics (gold vs index vs crypto).
Example
If gold is expected to move from 2,034 to 2,100 with a measured angle, you might enter at 2,034 with a stop at 2,020. Once price moves +20–30 points in your favor, start trailing to lock in some gains — otherwise, a dominance event can erase unrealized profits quickly.
💸 Trade sizes, costs, and why small lots matter
In the session I highlighted real numbers: three hundred dollars per lot is not imaginary — and if you’re trading smaller sizes like 0.1 lot (roughly $30) or 0.5 lot (around $150), your P&L will feel different. Small sizes help manage risk, but they also mean you can’t force the market to behave differently.
Why I stress this: unrealistic expectations for profit or speed often come from mismatched position sizing. If you’re expecting huge gains from a 0.1 lot position within minutes, you’ll feel frustrated. Set realistic goals, size appropriately, and use the AI targets as one input.
🧭 Live examples and quotes from the session
“There is one place — entry or exit — where a common public will come from E to X. But Ammani decided to come to your event and entered from here with forty, fifty vehicles. Can you stop him? No.” — Rocketalgo Official
I used this to drive home how institutional flow trumps simple retail logic. Also: “Angle must be compulsory — angle plus volume profiling.” This is not dogma; it’s practical. When both align we have higher probability setups. When they diverge, be cautious.
📚 Education, paid courses, and expectations
We invest heavily in education and platform development — the project behind the indicator and back-end AI cost several lakh rupees. We offer paid courses and trials because quality education is resource-intensive. If you join a paid class, please respect the time and effort instructors devote. Dropping calls or leaving mid-session undermines the learning experience for everyone.
We do weekend deep-dive sessions and advanced classes for traders willing to commit. These classes focus on technical mechanics (angle interpretation, volume profiling), behavioral money management, and how to implement AI targets practically.
🔧 Operational & support details
Practical operational information we provided during the session:
- Learning portal: https://galaxy.rocketalgo.in/
- Guides: guide.rocketalgo.in
- Learning app: learn.rocketalgo.in/app
- Website: rocketalgo.in
- Contact: +91-77-969-83-999
If you face issues like crypto withdrawals or account problems, we advised contacting broker support; we can share support numbers for assistance. During the session I also provided a reference support string for quick help.
📌 Practical checklist — What to do before placing a trade
- Confirm the angle on the timeframe you trade — short timeframe or longer timeframe depending on intraday vs swing.
- Check volume profile: where is the high volume node (the blue zone)?
- Ask: is there any sign of dominance that can disrupt the expected flow?
- Review AI target range as a probabilistic guide, not a certainty.
- Set initial stop loss and plan a trailing stop loss rule before entry.
- Size your position consistent with your account and the expected volatility.
- Monitor time-based participation — price alone is not sufficient.
🧠 Mindset and etiquette reminders
Three simple but vital reminders I emphasized:
- Respect the learning process: paid sessions require commitment.
- Don’t interrupt the flow: let the teacher finish the concept before asking questions.
- Use the tools, but don’t become tool-dependent. Trading is about judgment, risk management, and discipline.
❓ Frequently Asked Questions (FAQ) — Quick answers to what people asked
Q: How does dominance differ from a normal volume spike?
A: Dominance implies a concentrated, directional participation by a large player that changes the normal flow — not just a spike in volume from many small trades.
Q: Are your AI targets always hit?
A: No. The AI produces probabilistic targets based on historical and session data. They are realistic and data-driven, but not guaranteed.
Q: What timeframe should I use angle on?
A: Use the timeframe that matches your trading horizon. Intraday traders might use 1–15 minute charts; swing traders should use 4H or daily. Always align timeframe with risk management.
Q: How do I handle resistance if AI target is beyond it?
A: Expect churn at resistance. Use partial profit booking at obvious resistances, and then trail stops on the rest to capture further moves if the structure breaks.
Q: How much does the course or indicator cost?
A: Specific pricing varies. We invest heavily in development (several lakh rupees), and we offer paid trials and courses. Contact +91-77-969-83-999 or visit our learning portal for details.
Q: Does the system work for indices and commodities like gold?
A: Yes. The AI and the indicator are designed to analyze instruments across equities, indices (Nifty, Bank Nifty), commodities (like gold), and crypto — but you must adapt the settings to the instrument’s volatility.
🔁 Common scenarios and how to respond
Below are typical scenarios I described in the live session with practical responses:
- Scenario: Angle up + volume blue zone = probable buy. Response: consider entry, but place stop and plan trailing stop. Watch for dominance events.
- Scenario: Angle up + divergence in volume (low participation). Response: reduce expectations; tighten stop or scale position size down.
- Scenario: Sudden drop due to institutional sell. Response: don’t panic; evaluate whether price falls into deeper support or is merely a short-term shakeout.
🧾 Closing thoughts — What I want you to remember
Trading is a game of probabilities. Combine angle, volume profiling, dominance awareness, and AI target guidance to tilt probabilities in your favor. Use trailing stop loss to protect profits. Size trades sensibly. And respect the learning process — both instructors and students deserve attention and commitment.
If you remember one metaphor from this piece, remember the convoy: a single “Ammani” can move markets temporarily. Never ignore who’s behind the volume.
📞 How to connect
For more resources, practice materials, and access to our TradingView indicator or paid classes, visit the learning portal at https://galaxy.rocketalgo.in/ or contact us at +91-77-969-83-999. Our guide library is at guide.rocketalgo.in and the learning app is available at learn.rocketalgo.in/app.
✅ Final checklist before you trade
- Confirm angle and volume profile alignment.
- Check for signs of dominance or large order flow that may disrupt the setup.
- Review AI targets and form a trade plan (entry, stop, trailing stop, target partials).
- Size the position based on account risk and instrument volatility.
- Respect resistance levels and book partial profits when logical.
- Follow your checklists — discipline outperforms prediction.
📘 Extra resources and recommended next steps
If you want to build skills incrementally:
- Start with paper trading setups using angle + volume profiling.
- Practice applying a trailing stop loss on each trade until it becomes second nature.
- Use the AI target as a teacher: study when it was right and when it was off; learn the patterns.
- Join structured classes to speed up learning — weekend deep dives are particularly effective.
📝 FAQ Recap — Quick reference
- Dominance = large participant disrupting local flow.
- Angle + Volume Profile = higher probability when aligned.
- AI targets = probabilistic guidance, not guarantees.
- Trailing stop = protect profits, essential for volatile instruments.
- Size appropriately and respect resistance levels.
🙌 Thank you — see you in the next session
Thanks for reading. I’ll keep improving the tools and content based on your feedback. If you have questions, share them through our contact channels. Trade safely, and keep your risk first.
Need more help |
|
Contact us by clicking the button below |
|
Click me |

