
Welcome. In this long-form guide I will walk you through the latest Rocketalgo setup, what changed in the new version, how to read its signals, and how to use it for intraday and options trading effectively. If you trade in India or globally, whether you trade NSE or BSE instruments, commodities, crude or US penny stocks, these concepts are directly relevant. I’ve kept the voice conversational and practical — the same way I explain things in my live sessions. Throughout this article you will see concrete examples, live trade explanations, screenshots, and a no-nonsense approach to risk management and avoiding scammers.
Keyphrase focus: This article is optimized for the search phrase trading, stock market, NSE, BSE, Nifty and will use it repeatedly in meaningful contexts so you can find this guide fast.
Table of Contents
- 🔎 What is Rocketalgo’s updated setup and why it matters
- 📈 The ABCMP formula broken down
- 🧠 How the new money-flow line is different
- 📸 Live trade examples and screenshots
- ⚙️ How to read the Rocketalgo interface — practical rules
- 🧾 Example stories — what members experienced
- ⚖️ Commodities, Forex, Options — where Rocketalgo works
- 🛡️ How to avoid scammers, bad tips, and auto-trading traps
- 🧰 Practical setup steps — what to do on your chart right now
- 🧩 Risk management and psychology
- 🧾 Tools & extensions I recommend
- ❓FAQ
- 🔚 Final thoughts and practical next steps
🔎 What is Rocketalgo’s updated setup and why it matters
Rocketalgo’s updated setup builds on a simple, consistent formula I call ABCMP — Angle, Breakout, Candle pattern, Money flow, and Percentage. When these components align, you get high-probability trades. The new version has upgraded how it computes the money-flow synchronization and institutional participation using deeper backtesting on historical data. Practically, that means the indicator lines you see on the chart are smarter at signaling when big players are participating versus when retail noise is creating fake moves.
Why does this matter for someone trading, stock market, NSE, BSE, Nifty? Because intraday moves and options trades depend on identifying real directional momentum. The new Rocketalgo setup increases clarity by using:
- Refined money-flow line that sticks to candles when conditions match
- Color-coded trend signals (green for up, red for down, blue dotted for trend markers)
- Backtested thresholds for percentage confidence shown on the interface
The end result: clearer entries, fewer false breakouts, and better sizing decisions.
📈 The ABCMP formula broken down
Let’s unpack the ABCMP formula in plain terms so you can use it immediately on your charts.
- A — Angle: The angle is the geometric tilt of the directional movement. We use a simple rule: an angle above roughly 30 degrees gives high-probability trade prospects. Use a protractor Chrome extension or measuring tool to confirm when you’re learning.
- B — Breakout: A validated breakout is a price movement that breaks a recent resistance/support with supporting volume or the Rocketalgo’s green/red stick-to-candle line.
- C — Candle pattern: Look for a confirming candle structure — momentum candle, engulfing candle, or strong closes near highs/lows.
- M — Money flow: Now upgraded. The algorithm studies volume, VWAP, moving averages, and other internal parameters to determine institutional money flow. When the stick-to-candle line turns green and the dotted trend line supports it, the probability of an uptrend increases.
- P — Percentage: Rocketalgo displays a percentage confidence value. Higher percentages (70% plus) mean a higher probability of success.
Put together: when Angle + Breakout + Candle + Money flow + Percentage align, the trade becomes predictable and repeatable. This is the backbone of how you can trade more calmly and reduce impulsive entries.
🧠 How the new money-flow line is different
Earlier versions had a yellow line that oscillated. That gave flags but required interpretation. In the new version we did deep calculations and historical studies so the system now uses:
- A stick-to-candle colored line that follows price closely when institutional conditions are met
- Green color when institutional buying conditions are satisfied
- Red color when institutional selling conditions are present
- A blue dotted trend line that shows broader directional trend
Important nuance: the colored stick line is not the dotted trend line. The blue dotted line is a trend marker. The stick line glues itself to candles and changes color immediately when volume+VWAP+internal rules indicate directional strength. We use both together — the dotted line for the trend context, the stick line for immediate money-flow confirmation.
📸 Live trade examples and screenshots
Examples teach better than theory. Below are live examples I shared and explained — with screenshots and annotations you can match to your charts.
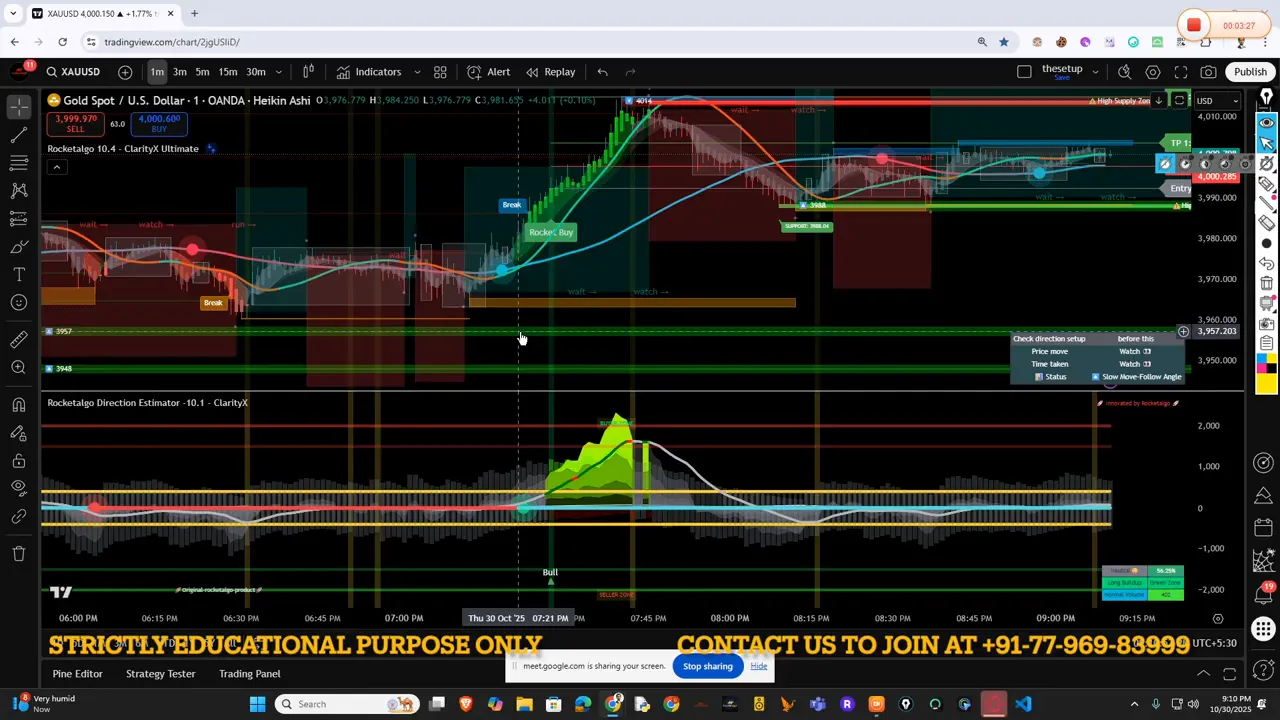
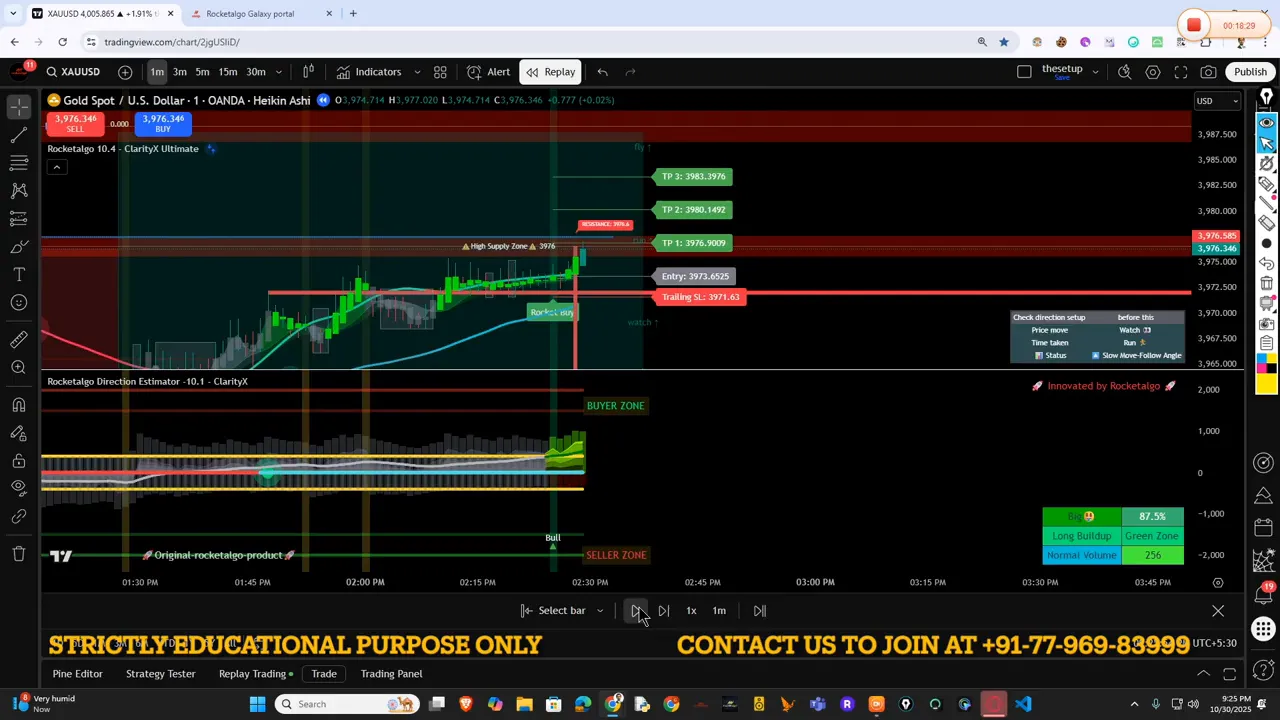
Example 1: A replayed trade (entry ~3992 to 4011). The angle formed, the stick line turned green and the dotted trend confirmed. Even a small lot captured a clean intraday move.
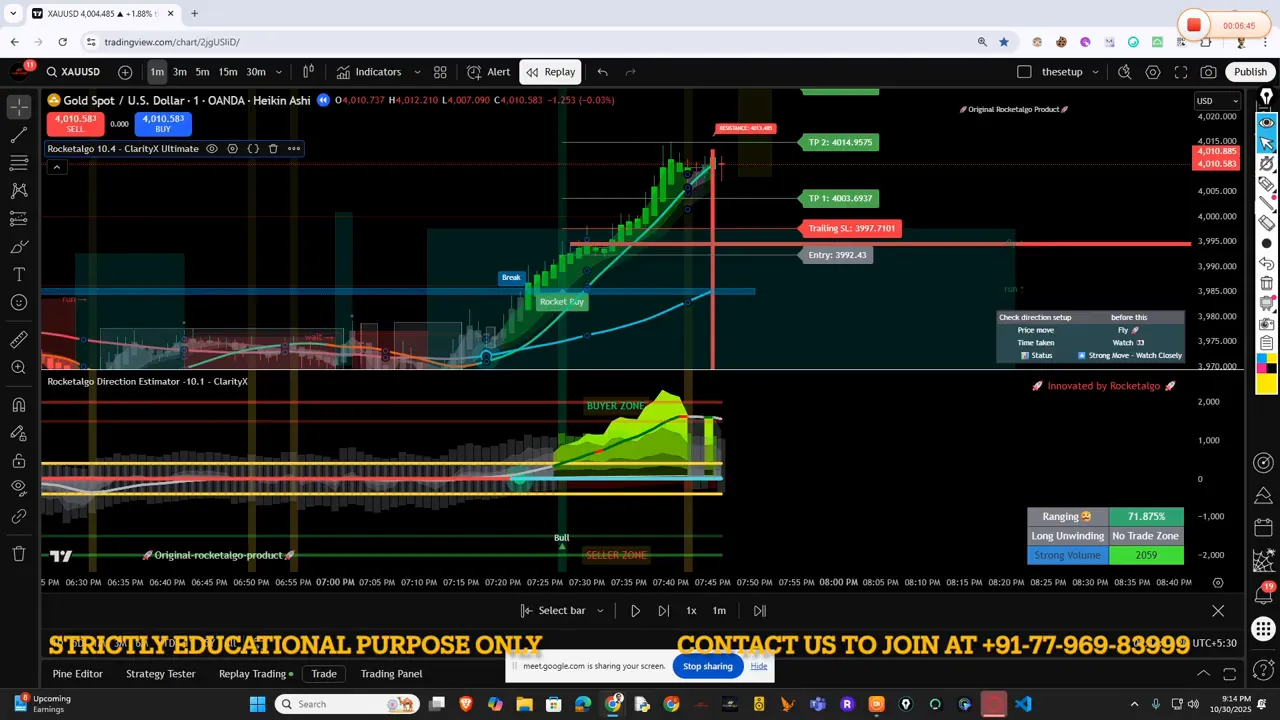
Example 2: An 87% confidence signal — Rocketalgo loaded the backtested conditions and displayed a high-probability breakout; the trade moved beyond target levels and validated the system’s projection.
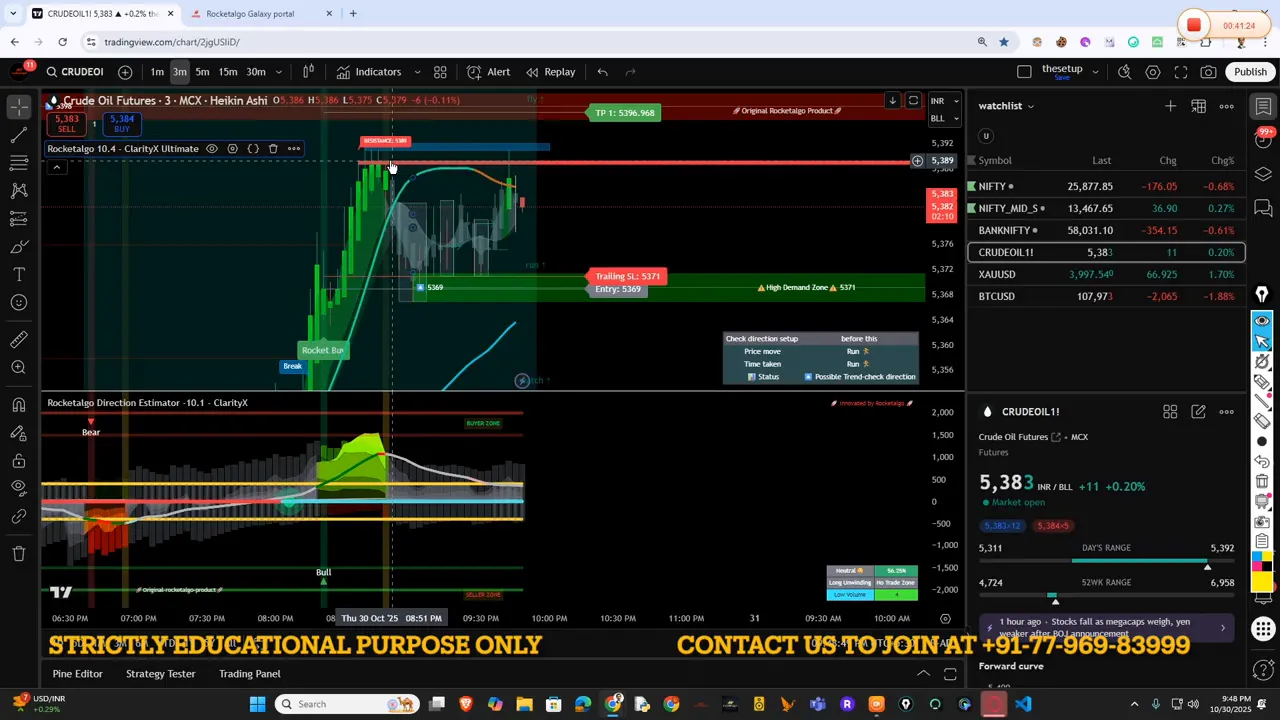
Example 3: Crude oil call option. Entry at 5369 and target to 5389 — a 20 point move which equated to roughly 2000 rupees on a single lot for many traders. The angle was clear and the money flow line indicated buyer participation.
Example 4: A penny stock in US premarket that moved over 200% in a session. The algorithm picked up institutional-like momentum and amplified returns. Penny stocks require strict risk controls, but Rocketalgo showed the kind of signal clarity we expect in high-momentum moves.
⚙️ How to read the Rocketalgo interface — practical rules
Reading signals is as much about rules as it is about interpretation. Here are practical must-follow rules that I always repeat to my group:
- Only take trades when the stick line is in the same direction as the dotted trend line.
- Prefer trades with percentage confidence above 70% — higher is better.
- Measure the angle. If it is below 25 degrees, treat the move as weak or sideways; above 30 degrees, the trade has more momentum.
- Don’t confuse short-lived spikes because small players can create fake volume. Wait for the stick-to-candle line to sustain for a few bars.
- Use the algorithm’s percent and angle together — both must support your entry.
One practical tip I always stress: calm trading wins. When you’re excited and throwing orders because “the line turned green,” you invite losses. Let the algorithm give you the signal and then act with defined stop-loss and position size.
🧾 Example stories — what members experienced
Real traders messaged me with screenshots. Ankush, for example, shared a replay profit of a trade where a small lot earned a neat intraday gain. If he had held a larger position, the numbers would have magnified but so would risk. The lesson: stick to your risk plan, scale positions, and respect the rocket algo signal rather than hope for bigger returns.
I also shared that one of our community members recovered heavy past losses and is now over 300% profitable at the portfolio level after following systematic trading rules and Rocketalgo’s signals. These are not claims to guarantee results; they are examples of disciplined traders using the setup and improving outcomes.
⚖️ Commodities, Forex, Options — where Rocketalgo works
Rocketalgo is not limited to equity intraday. The setup applies to various instruments with a few points to note:
- Commodities: Works well from 9am to 11pm session coverage. Crude and other commodities gave clear angle-based moves.
- Forex and XAU: Works but be mindful of the broker, liquidity and withdrawal methods.
- Options: For Nifty options, load the option premium chart (for example, choose the nearest expiry). Use the same angle, breakout and money flow logic on option premium charts.
On options specifically, a quick workflow is: type “Nifty” > go to “Options” > pick the nearest expiry > choose the strike contract (call/put) > open the premium chart and apply Rocketalgo. This helps you assess whether premium is moving with institutional flow or being manipulated by retail spikes.
Remember: options premium can be more volatile and require tighter risk controls, but the algorithm’s angle and percent help you filter noisy contracts.
🛡️ How to avoid scammers, bad tips, and auto-trading traps
One repeated message I give: avoid tip sellers, shady auto-trading services and any service that hides office or team details. If someone cold-calls and promises guaranteed returns or pushes you to deposit huge sums into crypto or offshore brokers, it is a red flag.
Practical defense checklist:
- Do not trust random tips. If you take tips, verify the track record and ask for independent verification.
- Avoid auto-trading robots that you cannot audit. Most “guaranteed” auto systems are traps.
- Prefer regulated brokers, and handle withdrawals carefully if you move funds internationally.
- Ask for transparency: a real service will show process, backtests, and clear support channels.
Learning to say no to quick-scheme callers saved many traders from ruin. Use a calm evaluation approach: check what the algorithm actually signals on your chart before doing anything.
🧰 Practical setup steps — what to do on your chart right now
If you are ready to try the updated Rocketalgo setup, here is a step-by-step checklist to apply immediately:
- Install the trading platform you use and add the Rocketalgo indicator or plugin as instructed in your service access.
- Open the instrument you want to trade: Nifty options, a specific equity on NSE or BSE, crude oil chart, or forex pair.
- Let the algorithm load historical back data — first load can be slower because it analyzes deep history.
- Watch for the colored stick-to-candle line and the dotted trend line. Confirm angle with a protractor tool on chart or a built-in degree measure.
- Check the Rocketalgo percentage value. Prefer entries above 70%, but use your taste and risk plan.
- Place a stop-loss based on recent structure (support/resistance or ATR) and set an initial target based on measured move or trailing stop.
- For options, open the premium chart for the strike and expiry you plan to trade and analyze the same Rocketalgo signals there.
One concrete visualization tip: install a protractor extension in Chrome if you use web charts. This helps you measure the angle quickly. Many of the high-probability trades had angles in the 30-60 degree range.
🧩 Risk management and psychology
Trading is not only signals and code; it is psychology. The algorithm helps you by filtering signals, but your discipline defines outcomes. Here are the core rules I recommend:
- Never over-leverage. Small lots are fine until you have consistent edge.
- Take small position sizes initially and scale using verified wins.
- Do not chase trades when the angle is unclear. Wait for confirmation.
- Journal every trade: why you took it, entry, exit, and what the Rocketalgo signals were.
- Set maximum daily loss and stop trading for the day if it is breached.
Calm traders outlast the loud ones. I repeat this often: calm trading is profitable trading. If you find yourself excited and placing trades without the full ABCMP alignment, pause. Walk away. Come back with a plan.
🧾 Tools & extensions I recommend
Some practical items to make your life easier:
- Protractor Chrome extension for angle measurement (search “Protractor PRO” or “Protractor extension” and install).
- A reliable data feed and broker that supports options premium charts for your local market.
- A notebook or digital journal to record every Rocketalgo signal you act on.
- Risk calculator to pre-determine position sizing for each percentage of account risk.
❓FAQ
What is the single most important rule when using the new Rocketalgo setup?
Follow the ABCMP alignment — Angle + Breakout + Candle + Money flow + Percentage. If all five components confirm, the trade has higher probability. Combine that with proper stop-loss and position sizing.
Can I trade commodities and crude oil with Rocketalgo?
Yes. The system works on commodities and crude oil. Many users trade these instruments from 9am to 11pm. The same angle and money-flow rules apply. On crude, for example, a 20 point move can be significant and profitable if position size is managed properly.
How do I use Rocketalgo for Nifty options?
Open your trading platform, search Nifty, go to the Options section, choose the nearest expiry, select the strike (for example 24xxx calls), and open the premium chart. Apply Rocketalgo and use ABCMP logic on the premium chart to assess if premium is moving with real institutional flow.
What does the stick-to-candle green line mean?
The green stick-to-candle line indicates that the combined internal conditions — volume, VWAP, moving averages and other parameters — are matching a pattern historically associated with institutional buying. It signals higher chance of an upward trend but should be used with the dotted trend line and percentage value for confirmation.
How do I measure the angle and what threshold should I use?
Use a protractor tool on your chart. Angles above approximately 30 degrees are preferred. Trades with sustained angles above 30 degrees tend to produce stronger momentum. Below 25 degrees, treat the market as weak or sideways and avoid taking aggressive entries.
How do I protect myself from scammers who offer tips or automated robots?
Avoid tip sellers who call or promise guaranteed returns. Do not use opaque auto-trading systems that hide ownership. Use regulated brokers and verify any service with independent proof and transparency. Stick to verified signals and disciplined money management.
🔚 Final thoughts and practical next steps
To recap: the latest Rocketalgo update improves money-flow detection by deep historical backtesting and clearer stick-to-candle visual signals. Use the ABCMP formula, measure angle with a protractor, prefer higher percentage signals, and always trade with a plan. This applies whether you trade Nifty options, NSE or BSE equities, commodities, crude oil, or forex pairs.
Practical next steps for you right now:
- Open your charting platform and load a Rocketalgo indicator for your preferred instrument.
- Allow the system to load back-data fully; it may be slower the first time.
- Look for alignment: green/red stick line + dotted trend + angle > 30 degrees + percentage > 70%.
- Place the trade with disciplined stop-loss and position sizing. Journal the outcome.
If you follow the method consistently and keep your psyche calm, you will see far better clarity in your intraday and options trading. Use this guide as a checklist and refer back to the screenshots and examples above when you need to match signals to live charts. Trade safe and stay disciplined.
Keywords for search visibility: trading, stock market, NSE, BSE, Nifty — use these as you search for setups, and remember the ABCMP formula as your quick checklist before each trade.
Need more help |
|
Contact us by clicking the button below |
| Click me |

