
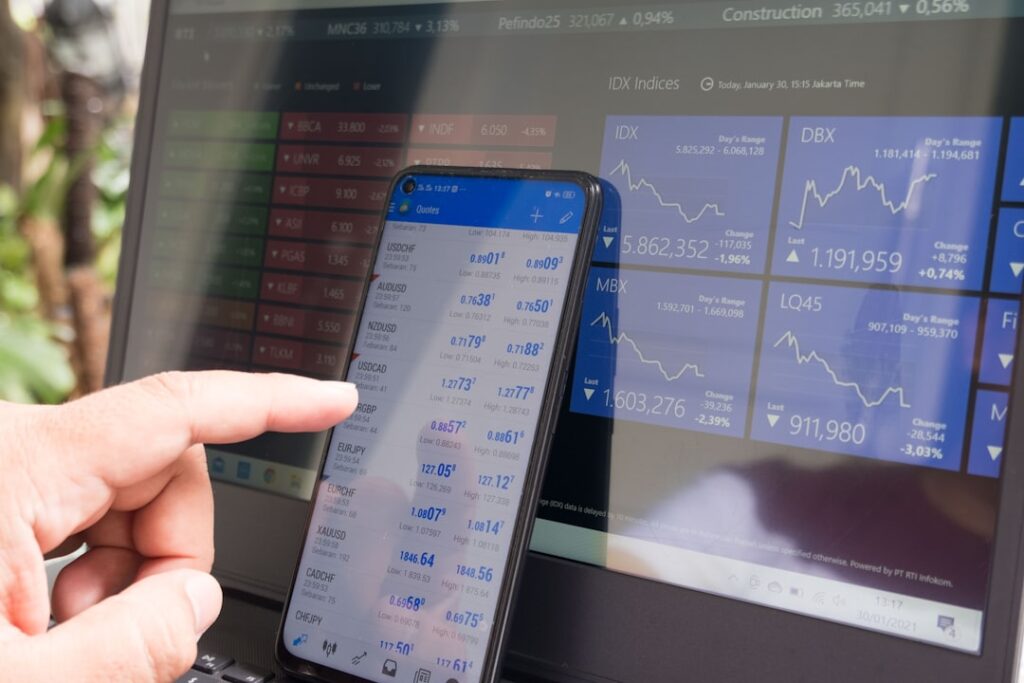
The dawn of 2026 presents a landscape of evolving market dynamics, heightened volatility, and the continuous quest for an edge in the fast-paced world of intraday trading. As algorithmic trading and machine learning permeate the financial markets, the discerning trader understands that success hinges not just on strategy, but on leveraging the most potent analytical tools. TradingView, the ubiquitous charting platform, remains a cornerstone for many, offering a rich ecosystem of indicators designed to illuminate price action and reveal potential trading opportunities.
For the intraday trader, precision and speed are paramount. The ability to identify trends, gauge momentum, and anticipate reversals in real-time separates the successful from the sidelined. In 2026, certain indicators, refined by years of market observation and technological advancement, continue to stand out as indispensable for navigating the intraday horizon. This article delves into the best TradingView indicators that will equip you for success in the dynamic intraday trading environment of 2026. We will explore how to effectively combine these tools to build robust trading systems and make informed decisions that can lead to consistent profitability.
Trend following indicators are the bedrock of many successful trading strategies, and in 2026, their importance is amplified. Intraday trading, with its shorter timeframes, necessitates a keen understanding of immediate price direction. The ability to hop on a nascent trend and exit before a reversal can be the difference between a profitable scalp and a losing trade. These indicators help traders identify the prevailing trend, its strength, and potential turning points, providing a clear directional bias for their trades.
Moving Averages: The Timeless Classic
Moving Averages (MAs) remain a fundamental tool for identifying trends. Their simplicity belies their power when applied correctly. For intraday trading, shorter-term MAs are crucial for capturing rapid price shifts.
Exponential Moving Averages (EMAs) for Enhanced Responsiveness
While Simple Moving Averages (SMAs) are foundational, Exponential Moving Averages (EMAs) offer greater responsiveness to recent price action. This is vital for intraday traders who need to react quickly to changing market conditions. The weighting of recent prices in EMAs allows them to signal potential trend changes sooner than SMAs.
Choosing the Right EMA Periods for Intraday
The choice of EMA periods is critical. For very short-term intraday trading (e.g., 1-minute or 5-minute charts), traders often use EMAs like 8, 13, 21, or 50. For slightly longer intraday frames (e.g., 15-minute or 30-minute charts), longer periods such as 50, 100, or even 200 EMAs can still provide valuable insights into the broader intraday trend. Experimentation with different combinations is key to finding what works best for your chosen timeframe and trading style.
EMA Crossovers as Entry and Exit Signals
A common strategy involves using the crossover of two EMAs of different periods. A bullish signal is generated when a shorter-term EMA crosses above a longer-term EMA, suggesting an upward trend is forming. Conversely, a bearish signal occurs when the shorter-term EMA crosses below the longer-term EMA, indicating a potential downtrend. These crossovers can serve as potent entry and exit points.
The Power of Multiple Moving Averages in Confluence
Employing a combination of EMAs can provide a more robust picture of the trend. For example, using a 20 EMA, 50 EMA, and 200 EMA on an intraday chart can reveal multiple layers of trend confirmation. When all three EMAs are aligned and trending in the same direction, it signifies a strong conviction in that trend.
The Average Directional Index (ADX): Gauging Trend Strength
While EMAs tell you the direction, the Average Directional Index (ADX) quantifies the strength of that trend. This is indispensable for intraday traders who want to avoid choppy, directionless markets and focus on periods of strong momentum.
Understanding ADX and its Components
The ADX itself is an oscillator that ranges from 0 to 100. A reading above 20 generally indicates an emerging trend, while a reading above 25-30 suggests a strong trend. Readings below 20 often signal a weak or non-existent trend, making it an ideal filter for avoiding trades in such conditions. The ADX is derived from two other lines: the Positive Directional Indicator (+DI) and the Negative Directional Indicator (-DI). The interplay between these lines and the ADX provides a comprehensive view of trend strength and direction.
Utilizing ADX to Filter Trades
For intraday traders, using the ADX as a filter is a crucial tactic. Before entering a trade based on other indicators, check the ADX. If the ADX is below 20-25, it might be prudent to sit on the sidelines, as the market may be too directionless for a profitable trend-following trade. Conversely, a rising ADX above 25 signals an opportune moment to consider entering a trade aligned with the prevailing trend.
ADX Divergences and Potential Reversals
While primarily a trend strength indicator, ADX divergences can sometimes signal potential trend reversals. If the price is making new highs but the ADX is making lower highs, it might indicate that the bullish momentum is weakening, and a reversal could be imminent. The same logic applies in reverse for bearish divergences.
Momentum Oscillators: Capturing the Force of Price Swings
Momentum oscillators are essential for intraday traders as they measure the speed and strength of price movements. They are particularly useful for identifying overbought and oversold conditions, potential reversals, and confirming the strength of existing trends. In the rapid-fire world of intraday trading, these indicators can provide crucial signals for timely entries and exits.
The Relative Strength Index (RSI): A Measure of Overbought and Oversold Conditions
The Relative Strength Index (RSI) is a widely used momentum oscillator that measures the magnitude of recent price changes to evaluate overbought or oversold conditions in an asset. It oscillates between 0 and 100.
Standard RSI Thresholds for Intraday Trading
Traditionally, an RSI reading above 70 is considered overbought, suggesting that an asset may be due for a price correction or reversal downwards. Conversely, an RSI reading below 30 is considered oversold, indicating that the asset may be due for a price bounce or reversal upwards. For intraday trading, these thresholds remain relevant, but traders often look for more nuanced signals.
RSI Divergences: Early Warning Signals of Reversals
One of the most powerful uses of the RSI for intraday traders is identifying divergences. A bullish divergence occurs when the price makes a lower low, but the RSI makes a higher low, suggesting that bearish momentum is weakening and a potential upward reversal is on the horizon. A bearish divergence occurs when the price makes a higher high, but the RSI makes a lower high, indicating that bullish momentum is fading and a potential downward reversal is likely. These divergences can be extremely valuable for anticipating turning points.
RSI as a Trend Confirmation Tool
Beyond overbought/oversold signals, the RSI can also confirm existing trends. If the RSI consistently stays above 50 during an uptrend, it indicates strong bullish momentum. Conversely, if the RSI remains below 50 during a downtrend, it suggests strong bearish momentum. Intraday traders can use this to reinforce their trend-following strategies.
Moving Average Convergence Divergence (MACD): Unveiling Momentum Shifts
The Moving Average Convergence Divergence (MACD) is a versatile momentum indicator that reveals the relationship between two moving averages of an asset’s price. It is composed of the MACD line, the signal line, and the histogram.
The MACD Line and Signal Line Crossovers
The MACD line is calculated by subtracting the 200-period Exponential Moving Average (EMA) from the 12-period EMA. The signal line is a 9-period EMA of the MACD line. A bullish crossover occurs when the MACD line crosses above the signal line, suggesting upward momentum is building. A bearish crossover happens when the MACD line crosses below the signal line, indicating a potential shift to downward momentum. These crossovers are key signals for intraday traders.
The MACD Histogram for Momentum Strength
The MACD histogram displays the difference between the MACD line and the signal line. When the histogram is positive and rising, it signifies increasing bullish momentum. When it is negative and falling, it indicates increasing bearish momentum. The histogram can help intraday traders gauge the strength of a move and identify potential exhaustion points.
MACD Divergences: Predicting Trend Reversals
Similar to the RSI, MACD divergences can be powerful indicators of potential trend reversals. A bullish divergence occurs when the price makes a lower low, but the MACD makes a higher low. A bearish divergence happens when the price makes a higher high, but the MACD makes a lower high. These divergences provide early warnings of potential shifts in market sentiment.
Volume-Based Indicators: Confirming Strength and Liquidity
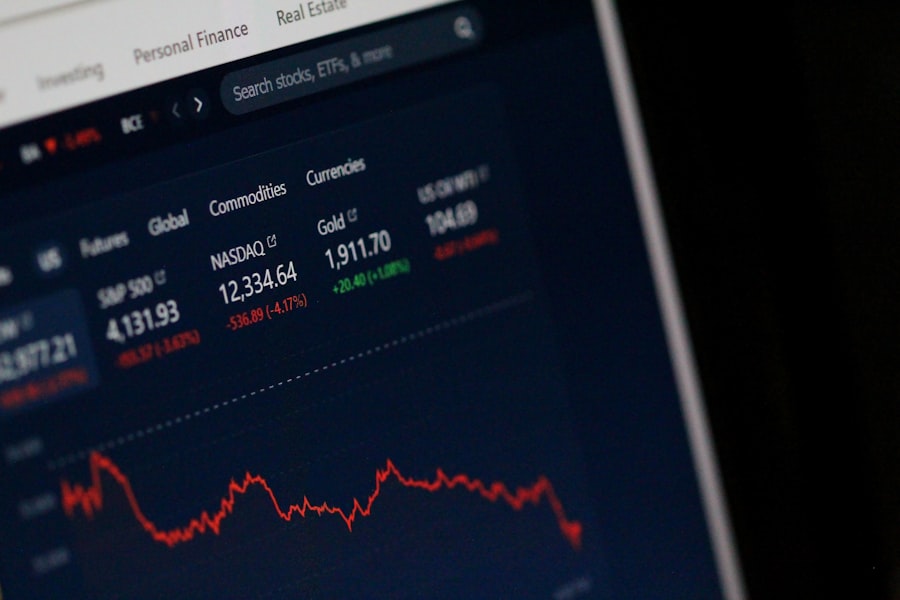
Volume is the lifeblood of any market. For intraday traders, understanding volume is crucial for confirming the strength of price moves, identifying potential fakeouts, and gauging the conviction behind a particular trend. Volume-based indicators can provide valuable insights that pure price action analysis might miss.
On-Balance Volume (OBV): Tracking Accumulation and Distribution
The On-Balance Volume (OBV) indicator relates volume to price change. It is a cumulative indicator that adds the volume of an up-period and subtracts the volume of a down-period. It helps traders identify whether volume is flowing into an asset (accumulation) or out of it (distribution).
OBV Divergences with Price Action
A key application of OBV for intraday traders is to look for divergences. If the price is making new highs but the OBV is not, it suggests that the upward move is not being supported by volume, potentially indicating a lack of conviction and a higher probability of a reversal. Conversely, if the price is making new lows but the OBV is making higher lows, it can signal that selling pressure is easing and a potential bounce is on the cards.
OBV as a Confirmation Tool for Trends
When the OBV is trending upwards along with the price, it provides strong confirmation of a bullish trend. Similarly, a downward trend in OBV alongside falling prices reinforces a bearish trend. Intraday traders can use this confirmation to increase their confidence in executing trades.
Volume Profile: Visualizing Trading Activity at Specific Price Levels
Volume Profile is a highly advanced indicator that displays trading activity at specific price levels over a defined period. Instead of just showing total volume, it breaks down volume traded at each price point, revealing areas of high and low trading interest.
Identifying Key Support and Resistance Levels with Volume Profile
Areas of high volume on the Volume Profile often represent significant support or resistance levels. These are price points where a substantial amount of trading occurred, indicating that traders have established positions and where future price action might find equilibrium or face strong opposition. Intraday traders can use these levels to anticipate potential turning points or breakouts.
The Point of Control (POC): The Most Traded Price Level
The Point of Control (POC) is the price level with the highest volume traded within a given period on the Volume Profile. This is often considered a magnet for price, and significant reactions can occur around this level. For intraday traders, the POC can act as a dynamic support or resistance.
Using Volume Profile for Breakout Confirmation
When a price breaks through a significant resistance level identified by Volume Profile, and this breakout is accompanied by high volume, it suggests strong conviction behind the move. Conversely, a breakout with low volume might be a fakeout. Intraday traders can use this to filter for more reliable breakout trades.
Volatility Indicators: Gauging Market Uncertainty and Opportunity

Volatility is the degree of variation of a trading price series over time, usually measured by the standard deviation of logarithmic returns. For intraday traders, understanding volatility is crucial for managing risk, setting appropriate stop-loss levels, and identifying periods of increased trading opportunity.
The Bollinger Bands: Dynamic Bands Reflecting Volatility
Bollinger Bands consist of a moving average (typically a 20-period SMA) and two standard deviation bands above and below it. As volatility increases, the bands widen; as volatility decreases, they narrow.
Identifying Volatility Expansion and Contraction
When the Bollinger Bands are widening, it indicates increasing volatility, suggesting that the price is likely to move further from the moving average. When the bands are contracting (the “squeeze”), it signals decreasing volatility, often preceding a period of significant price movement. Intraday traders can use the squeeze to anticipate potential breakouts.
Trading Reversals with Bollinger Bands
When the price touches the upper band, it can be an indication of an overbought condition, potentially signaling a short-term reversal downwards. Conversely, when the price touches the lower band, it can suggest an oversold condition and a potential upward reversal. However, in strong trends, prices can “walk the band,” so confirmation from other indicators is crucial.
Bollinger Band Breakouts as Trading Signals
A breakout of the Bollinger Bands can signal the start of a new trend or the continuation of an existing one, especially when combined with other indicators. A strong move outside the bands, particularly after a period of contraction, can be a potent signal for intraday traders.
The Average True Range (ATR): Measuring Price Range and Volatility
The Average True Range (ATR) measures market volatility by calculating the average of the true ranges over a specified period. The “true range” is the greatest of the following three values: the current high minus the current low; the absolute value of the current high minus the previous close; or the absolute value of the current low minus the previous close.
Setting Stop-Loss and Take-Profit Levels with ATR
One of the most practical uses of ATR for intraday traders is in setting appropriate stop-loss and take-profit levels. By multiplying the ATR by a factor (e.g., 1.5 or 2), traders can establish a stop-loss that is based on the asset’s typical volatility, providing a buffer against normal price fluctuations. Similarly, ATR can be used to set realistic profit targets.
Using ATR to Gauge Market Conditions
A high ATR reading indicates that an asset is experiencing high volatility, which can present more trading opportunities but also increased risk. A low ATR reading suggests lower volatility, meaning that price movements may be smaller and slower. Intraday traders can use ATR to adjust their position sizing and risk management strategies based on current market conditions.
Candlestick Patterns and Price Action Analysis: The Foundation of Trading
| Indicator | Description | Accuracy | Popularity |
|---|---|---|---|
| Relative Strength Index (RSI) | A momentum oscillator that measures the speed and change of price movements. | High | Very Popular |
| Moving Average Convergence Divergence (MACD) | A trend-following momentum indicator that shows the relationship between two moving averages of a security’s price. | High | Popular |
| Bollinger Bands | A volatility indicator that consists of a set of three bands plotted in relation to a security’s price. | Medium | Popular |
| Volume Weighted Average Price (VWAP) | An indicator used to identify the true average price of a stock by taking into account both volume and price. | High | Popular |
While indicators provide valuable insights, they are most effective when used in conjunction with a deep understanding of candlestick patterns and pure price action analysis. These elements form the fundamental language of the market, and mastering them is essential for any intraday trader.
Recognizing High-Probability Candlestick Patterns
Certain candlestick formations are known to signal potential reversals or continuations. For intraday trading, focusing on patterns that form on shorter timeframes can be particularly effective.
Reversal Patterns: Pin Bars, Engulfing Patterns, and Doji
- Pin Bars (or Shooting Stars/Hammers): These have a long wick and a small body, indicating a strong rejection of price at one extreme. A bullish pin bar (hammer) at support can signal a buying opportunity, while a bearish pin bar (shooting star) at resistance can signal a selling opportunity.
- Engulfing Patterns (Bullish and Bearish): A bullish engulfing pattern occurs when a large green candle completely engulfs the previous red candle, suggesting a shift in sentiment. A bearish engulfing pattern is the opposite, with a large red candle engulfing the previous green one.
- Doji: A Doji candle has a very small or non-existent body, indicating indecision in the market. Multiple Doji candles can signal potential trend reversals, especially when they appear after a sustained move.
Continuation Patterns: Marubozu and Three White Soldiers/Three Black Crows
- Marubozu: These candles have very long bodies and little to no wicks, indicating strong conviction in one direction. A bullish Marubozu suggests strong buying pressure, while a bearish Marubozu indicates strong selling pressure.
- Three White Soldiers: Three consecutive long green candles, each opening within the previous candle’s body and closing higher, signal strong bullish momentum.
- Three Black Crows: Three consecutive long red candles, each opening within the previous candle’s body and closing lower, indicate strong bearish momentum.
Support and Resistance Levels: The Pillars of Price Action
Identifying key support and resistance levels is paramount for intraday traders. These are price zones where buying or selling pressure has historically been strong enough to reverse or pause price movements.
Dynamic Support and Resistance from Moving Averages
As discussed earlier, moving averages can act as dynamic support and resistance. A rising moving average can act as support during an uptrend, and a falling moving average can act as resistance during a downtrend.
Trendlines as Dynamic Support and Resistance
Drawing trendlines connecting a series of higher lows in an uptrend (support) or higher highs in a downtrend (resistance) can provide dynamic support and resistance zones. A break of these trendlines can signal a significant change in the market’s direction.
Horizontal Support and Resistance: Historical Price Pivots
Horizontal support and resistance levels are identified by looking at previous price pivots. These are areas where the price has repeatedly bounced off in the past. Intraday traders can use these levels to anticipate potential turning points or to confirm breakouts.
Combining Indicators for a Robust Trading Strategy: The Synergistic Approach
The true power of TradingView indicators lies not in using them in isolation, but in their synergistic combination. By layering multiple indicators, traders can filter out false signals and increase the probability of success for their intraday trades. The goal is to find confluence, where multiple indicators are signaling the same outcome.
The Trend Following and Momentum Confirmation Strategy
A classic approach is to combine a trend-following indicator with a momentum oscillator.
- Step 1: Identify the Trend: Use EMAs (e.g., 50 EMA and 200 EMA) or the ADX to confirm the prevailing intraday trend. If the trend is bullish (price above EMAs, ADX above 25), look for buy opportunities.
- Step 2: Look for Momentum Confirmation: Use RSI or MACD to confirm bullish momentum. For a buy signal, you might look for the RSI to be above 50 and not overbought, or for a bullish MACD crossover.
- Step 3: Enter the Trade: Enter a long trade when both trend and momentum indicators align.
- Step 4: Manage Risk: Use ATR to set your stop-loss below a recent swing low or support level.
Volume Confirmation for Breakouts
Volume-based indicators can be critical for validating breakouts.
- Step 1: Identify a Potential Breakout: Watch for price breaking through a significant resistance level (identified by horizontal levels or Volume Profile).
- Step 2: Check for Volume Confirmation: Use OBV or the volume bars themselves to confirm the breakout. A breakout on high volume is more likely to be sustained.
- Step 3: Consider Momentum: Ensure that momentum oscillators like RSI or MACD are also showing positive signs to support the breakout.
- Step 4: Enter and Manage: Enter the trade on confirmation and set your stop-loss below the broken resistance level (now acting as support).
The Power of Divergence Trading with Multiple Indicators
Divergences can be powerful when confirmed by multiple indicators.
- Step 1: Identify a Potential Divergence: Look for a bullish divergence on RSI or MACD.
- Step 2: Check for Confirmation: See if price is approaching a key support level or forming a bullish candlestick pattern.
- Step 3: Look for Volume Signs: Observe if OBV is starting to show an upward trend or if volume is increasing on potential reversal candles.
- Step 4: Enter with Caution: Enter a long trade with a tight stop-loss just below the recent low, as divergences can sometimes fail.
The Importance of Backtesting and Forward Testing
Regardless of the indicators you choose and how you combine them, rigorous backtesting and forward testing are essential. Backtesting involves applying your strategy to historical data to see how it would have performed. Forward testing, or paper trading, involves executing your strategy in real-time without risking actual capital. This helps refine your strategy, identify its weaknesses, and build confidence before trading with real money.
Conclusion: Adapting to the Future of Intraday Trading in 2026
The intraday trading landscape in 2026 will undoubtedly be shaped by technological advancements and evolving market participant behavior. However, the fundamental principles of technical analysis, powered by effective indicators, will remain crucial. The indicators discussed in this article – Moving Averages, ADX, RSI, MACD, OBV, Volume Profile, Bollinger Bands, and ATR – represent a robust toolkit for the discerning intraday trader.
The key to success in 2026 will be the ability to adapt, to learn, and to skillfully combine these tools. Embrace the power of confluence, where multiple indicators align to provide strong trading signals. Master the art of risk management, using indicators like ATR to protect your capital. And always remember that continuous learning and practice are the most potent indicators of long-term success. By leveraging these best-in-class TradingView indicators with a disciplined approach, you can position yourself for profitable intraday trading in the dynamic markets of 2026 and beyond.

