


Table of Contents
- 🌟 Introduction — A quick note from Rocketalgo Official
- 📌 What you will learn in this article
- 🔍 What is Anpush dot logic? (Volume profiling reimagined)
- 🧩 How Anpush dot logic interprets past volume “experiences”
- ✅ ABCMP — the additional confirmation we talked about
- 🛠️ Practical setup: how we trade with Anpush (including blind trading joke)
- 📈 Real examples and trade snippets from the session
- 📸 Screenshots explained — what to look for in each image
- ⚖️ Risk management: what I emphasized during the session
- 📊 How to combine Anpush with other tools
- 🧠 Expectations & psychology — staying grounded
- 🔁 Trade lifecycle: from signal to exit
- 📌 Common pitfalls and how to avoid them
- 🎯 Practical checklist for your trading day
- ❓ Frequently Asked Questions (FAQ)
- 🔚 Closing thoughts — what I want you to take away
- 📚 Additional resources and keywords to explore
🌟 Introduction — A quick note from Rocketalgo Official
Hello — I’m the presenter from Rocketalgo Official, and in this post I’ll walk you through the market overview I shared on 2nd September 2025. If you follow our work, you know we focus on practical, tech-driven market insights. In that session I introduced a new tool we call “Anpush dot logic” — a volume-profiling oriented indicator that reassesses historical volume behavior and provides visual cues to support entries and exits. Whether you’re focused on trading, stock market, NSE, BSE, Nifty or simply looking for clearer intraday signals, this article will summarize the logic, the practical observations, and the setup pointers I covered in the session.
This article is structured to be actionable: I’ll explain the core ideas behind the Anpush dot logic, how it functions as a volume-profile confirmation tool, share real examples and screenshots from the live session, cover trade management and risk, and finish with an FAQ to answer common questions. I’ll also include practical tips for using the logic alongside conventional indicators when trading the trading, stock market, NSE, BSE, Nifty pairings and instruments.
📌 What you will learn in this article
- What Anpush dot logic is and why we built it.
- How the dot colors (red, blue, green) map to market states and volume analysis.
- How we use an additional ABCMP confirmation formula to reduce false signals.
- Real session examples and screenshots to help you decode live signals.
- Risk management, trade sizing, and setup tips for trading in the trading, stock market, NSE, BSE, Nifty environment.
🔍 What is Anpush dot logic? (Volume profiling reimagined)
At its core, Anpush dot logic is a volume-profiling derivative that we developed to provide a compact, actionable visual cue on price charts. The idea is simple: markets reveal conviction through volume distribution. Instead of showing raw volume histograms or complex profile plots, Anpush reassesses recent volume behavior and summarizes it into colored dots that indicate the market’s directional tendency and structural strength.
The primary outputs you see are colored dots — red dot, blue dot, green dot — each conveying a different state:
- Red dot — indicates potential distribution or selling pressure. It signals that volume characteristics resemble past situations where price tended to weaken.
- Blue dot — neutral or balanced state. This is useful for identifying consolidation zones where neither side has strong control.
- Green dot — suggests accumulation or buying bias. Historically, similar volume signatures preceded bullish responses.
We designed Anpush dot logic specifically for intraday and short swing contexts where quick visual confirmation helps traders act decisively. For traders of the trading, stock market, NSE, BSE, Nifty segments, the dots are meant to be a complementary lens — not the entire trading system. That means you should treat the dots as probabilistic information to be combined with structure, price action, and risk management.
🧩 How Anpush dot logic interprets past volume “experiences”
The phrase I used in the session — “reassess the past experiences of that particular volume” — is technical shorthand. Practically, Anpush analyzes segments of price action and asks: has this volume pattern been followed by strength or weakness historically? The algorithm compares the current volume-price snapshot against a library of patterns generated from historical intraday data.
Think of it as a pattern-matching engine:
- It slices recent price-volume data into features (relative volume, spike vs. steady flow, price range, context of trend or consolidation).
- It compares these features to historical “experiences” — i.e., labeled outcomes where similar patterns were followed by up moves, down moves, or neutral corrections.
- It outputs a dot color and optionally the strength of the match to inform traders whether the probability tilt favors buyers, sellers, or balance.
This is why volume-profiling matters: not all volume is equal. A volume spike during a rising trend often confirms continuation; a similar spike near resistance could be exhausted buying. Anpush tries to capture that nuance and summarize it in a concise way for quick decision-making in the trading, stock market, NSE, BSE, Nifty realms.
✅ ABCMP — the additional confirmation we talked about
During the session I mentioned a formula called ABCMP, which we use as an added layer of confirmation. In short, ABCMP is a lightweight rule-set that checks price structure around the dot signal. It’s not a magic formula; it’s an engineered check to make sure the dot is not acting in isolation.
The ABCMP confirmation includes checks like:
- Structure: Are higher highs and higher lows forming (bull) or lower highs and lower lows forming (bear)?
- Breakout validation: Has price broken a recent consolidation with follow-through volume?
- Momentum: Is intraday momentum aligned with the dot color (e.g., green dot with upward momentum)?
- Price acceptance: Does price accept the breakout/breakdown level or reject it quickly?
- Positioning: Are there visible clusters of orders or areas where other technical cues coincide?
We use ABCMP as “additional confirmation” to reduce false positives — especially on fast-moving instruments in the trading, stock market, NSE, BSE, Nifty ecosystem. That said, I also emphasized in the session that no confirmation is perfect; ABCMP merely shifts probabilities in your favor.
🛠️ Practical setup: how we trade with Anpush (including blind trading joke)
In the live session I joked about “blind trading” to make a point: no indicator should be used blindly. The directive was clear — set up your plan, backtest, and practice in a simulated environment before risking capital. Here’s a practical step-by-step setup you can adopt when trading intraday using Anpush dot logic with instruments on trading, stock market, NSE, BSE, Nifty:
- Chart timeframe: For intraday Nifty feels, we used 5-minute and 15-minute charts to capture both micro-structure and the day’s bias.
- Apply Anpush dot logic: Observe dot color changes and their location relative to immediate structure (support/resistance, VWAP, short moving averages).
- Run ABCMP: If the dot color aligns with ABCMP confirmation, consider a trade setup — entry on breakout or pullback, stop under recent swing, target based on ATR or discrete pivot points.
- Risk sizing: Use position sizing so that each trade risks a small percentage of capital (1% or less per trade is common for aggressive intraday traders).
- Monitor and adapt: On powerful trend days, hold winners with a trailing stop; on chop days, tighten stops and reduce size.
Remember: the “blind trading” bit was a jest to reinforce discipline. The indicator gives insight — you must still plan and manage trades responsibly, especially with instruments tied to trading, stock market, NSE, BSE, Nifty indices where volatility can be high.
📈 Real examples and trade snippets from the session
During the session I walked through several real trades and referenced contract counts, breakout targets, and screenshots of profit. Here are the educational highlights you can put into practice:
- Breakout trades: We identified breakout targets and noted how the dots helped confirm direction. For instance, when a green dot appeared in alignment with a breakout and ABCMP confirmation, we allowed the trade more room to run.
- Contracts and management: In the live example I mentioned specific contract counts (encyclopedic numbers like 542 contracts, 549 contracts) to illustrate how one might scale into a position. The numbers were illustrative, not prescriptive.
- Profit capture: The session showed screenshots and profit reports — these were shared to demonstrate the system’s behavior in live markets. Some users referenced positive P&L days (e.g., a user noting a 13,000 profit day), which I used to illustrate real-world outcomes when the system and risk rules align.
Use the trade snippets as case studies. The goal is to notice the relationship between dot signals, price structure, and the behavioral outcome rather than to copy trade sizes or specific entries blindly.
📸 Screenshots explained — what to look for in each image
Below I include screenshots taken from the session. I’ve annotated in the session itself, but here I’ll summarize what each image teaches you when trading in the trading, stock market, NSE, BSE, Nifty context.
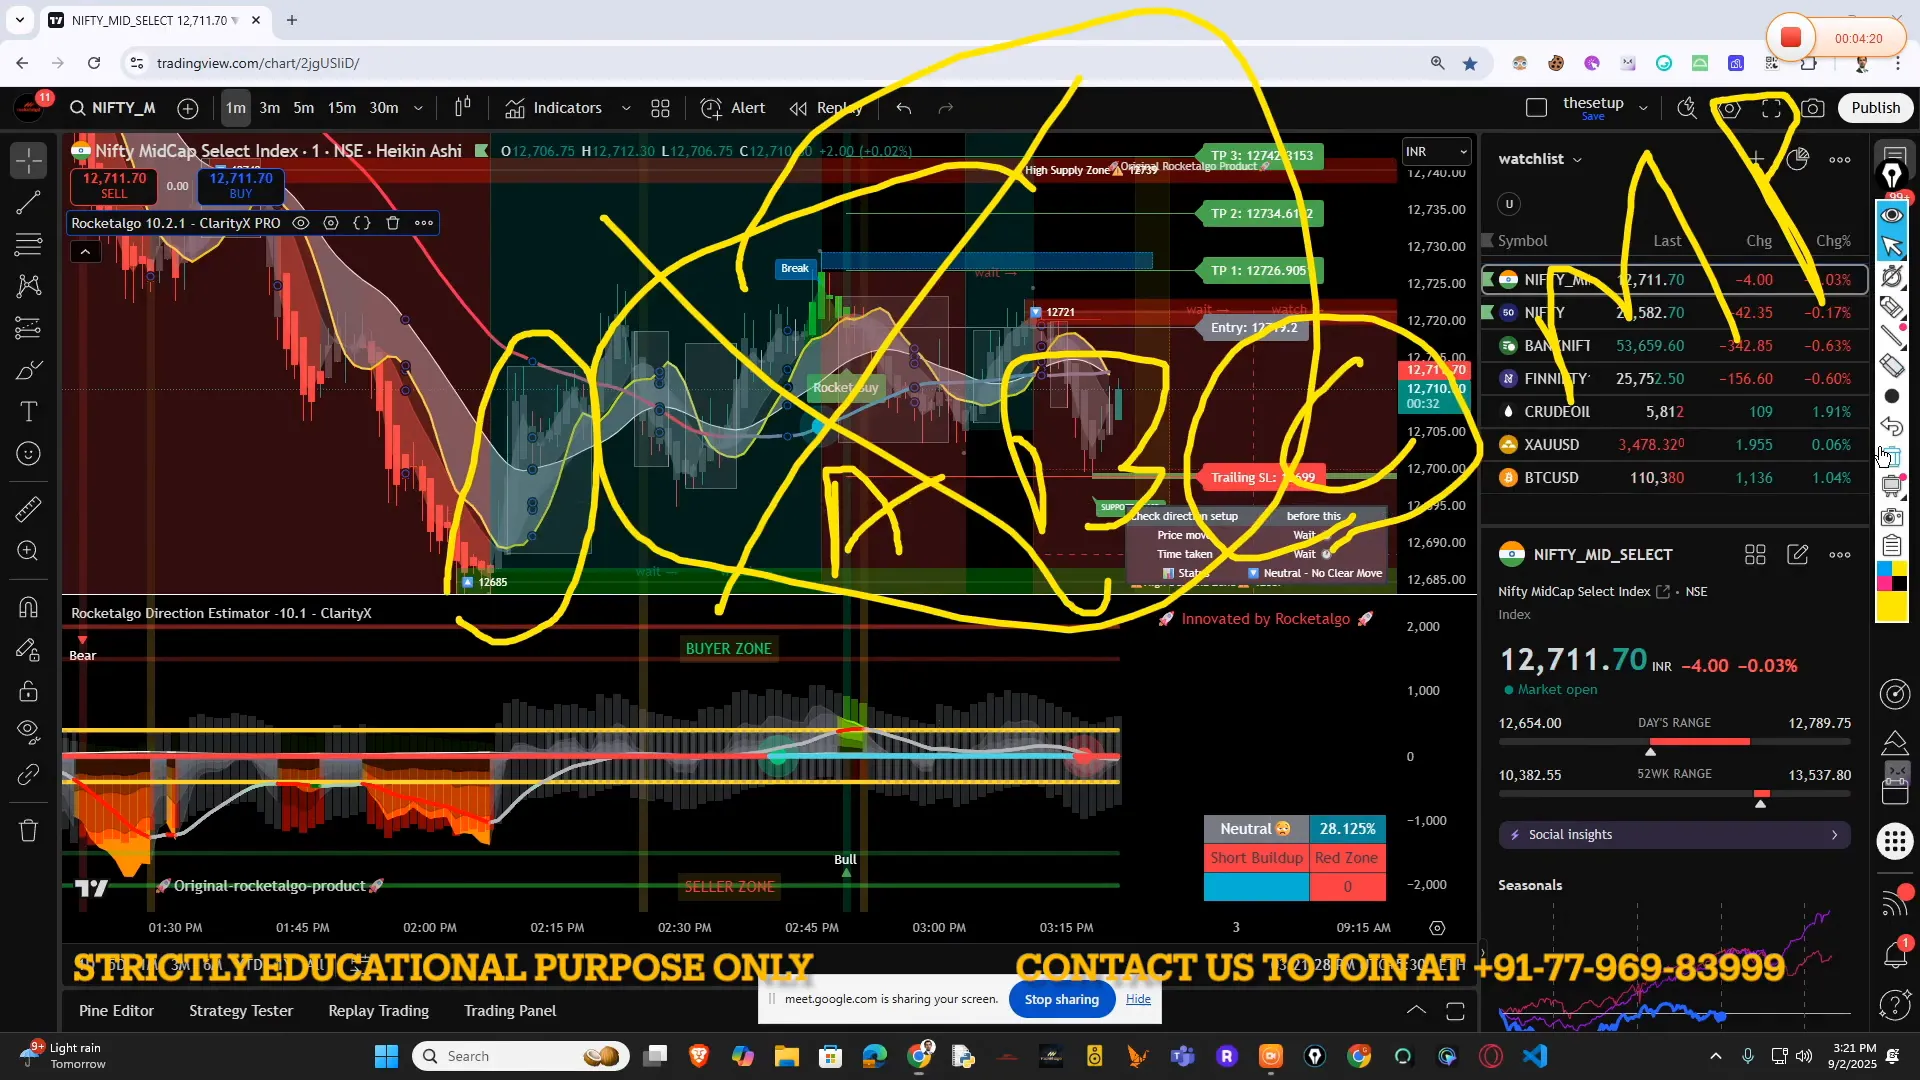
- Screenshot at 04:20 — Anpush introduction. Look for how the indicator places dots relative to recent highs/lows and how the color changes before a price move.
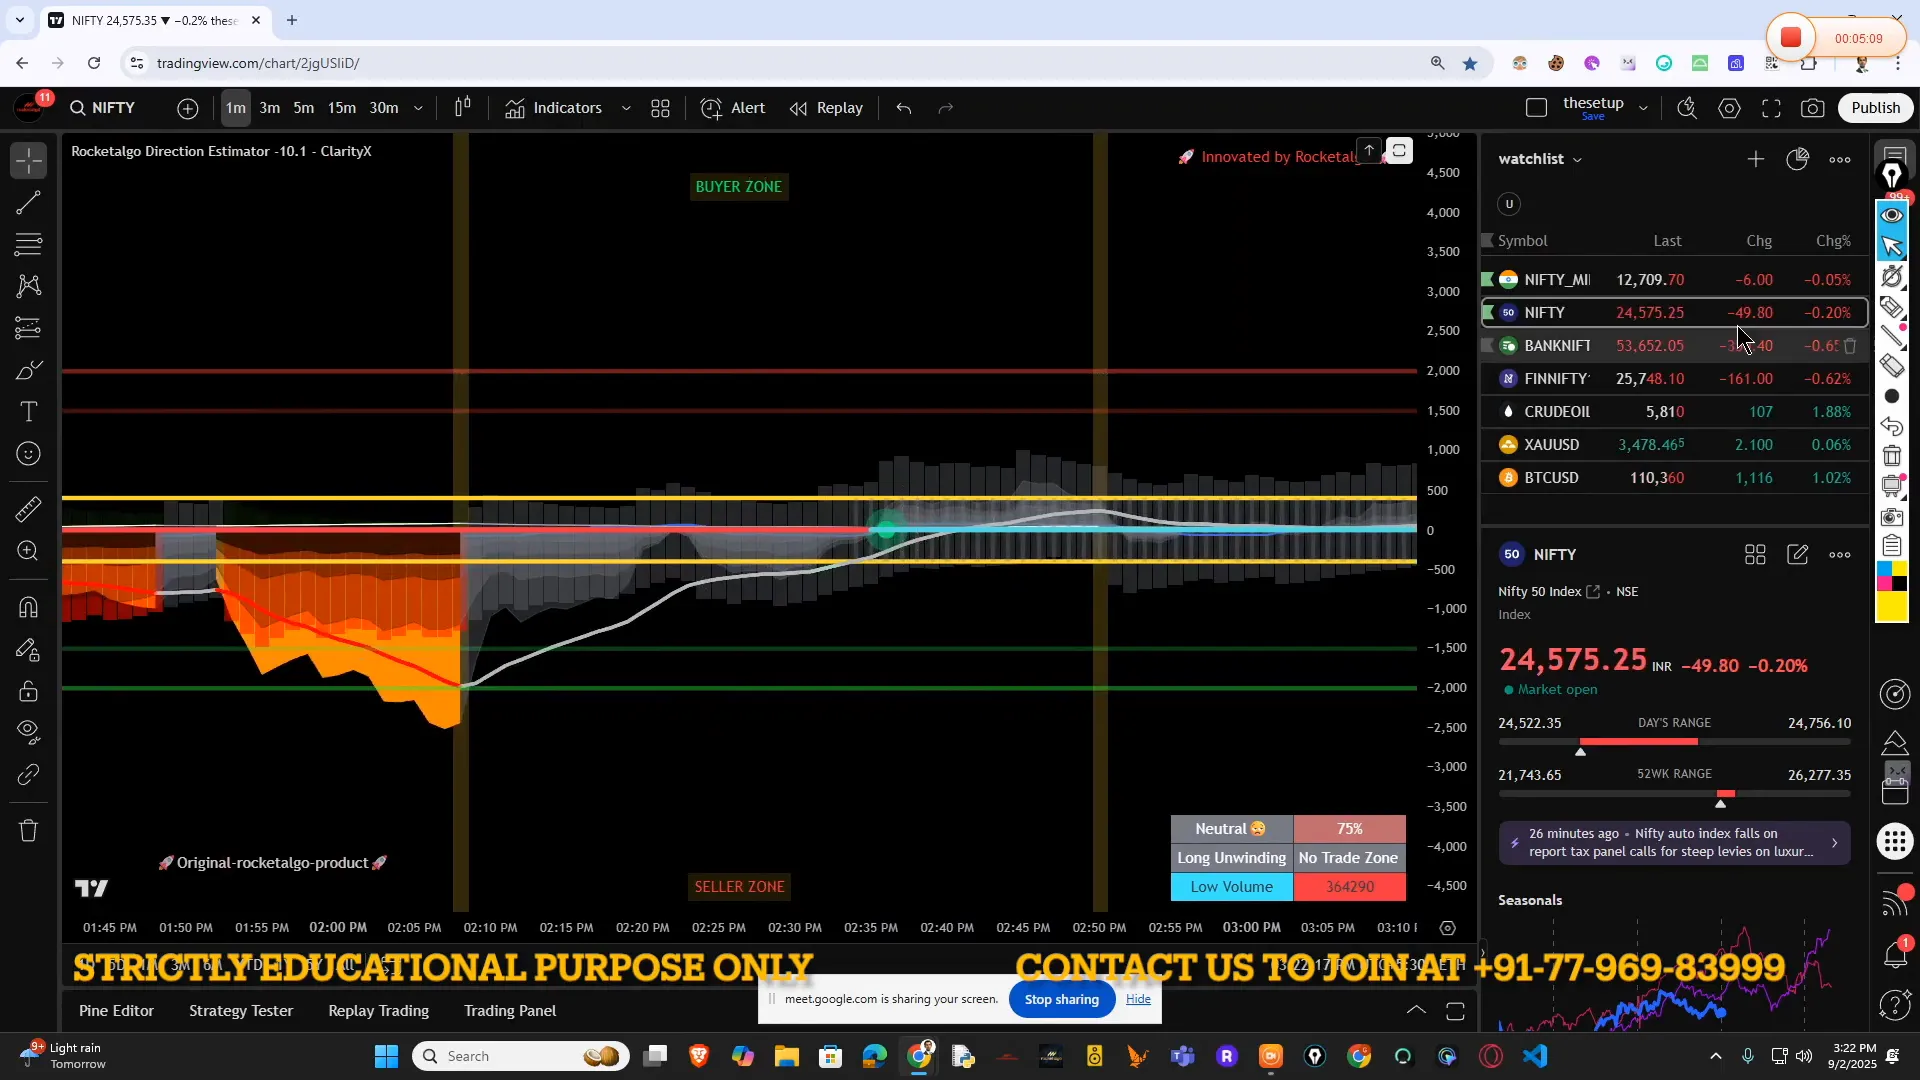
- Screenshot at 05:21 — Dot placements on a consolidation. Notice the blue dots that indicate balance and how breakouts out of that zone are validated by subsequent color shifts.
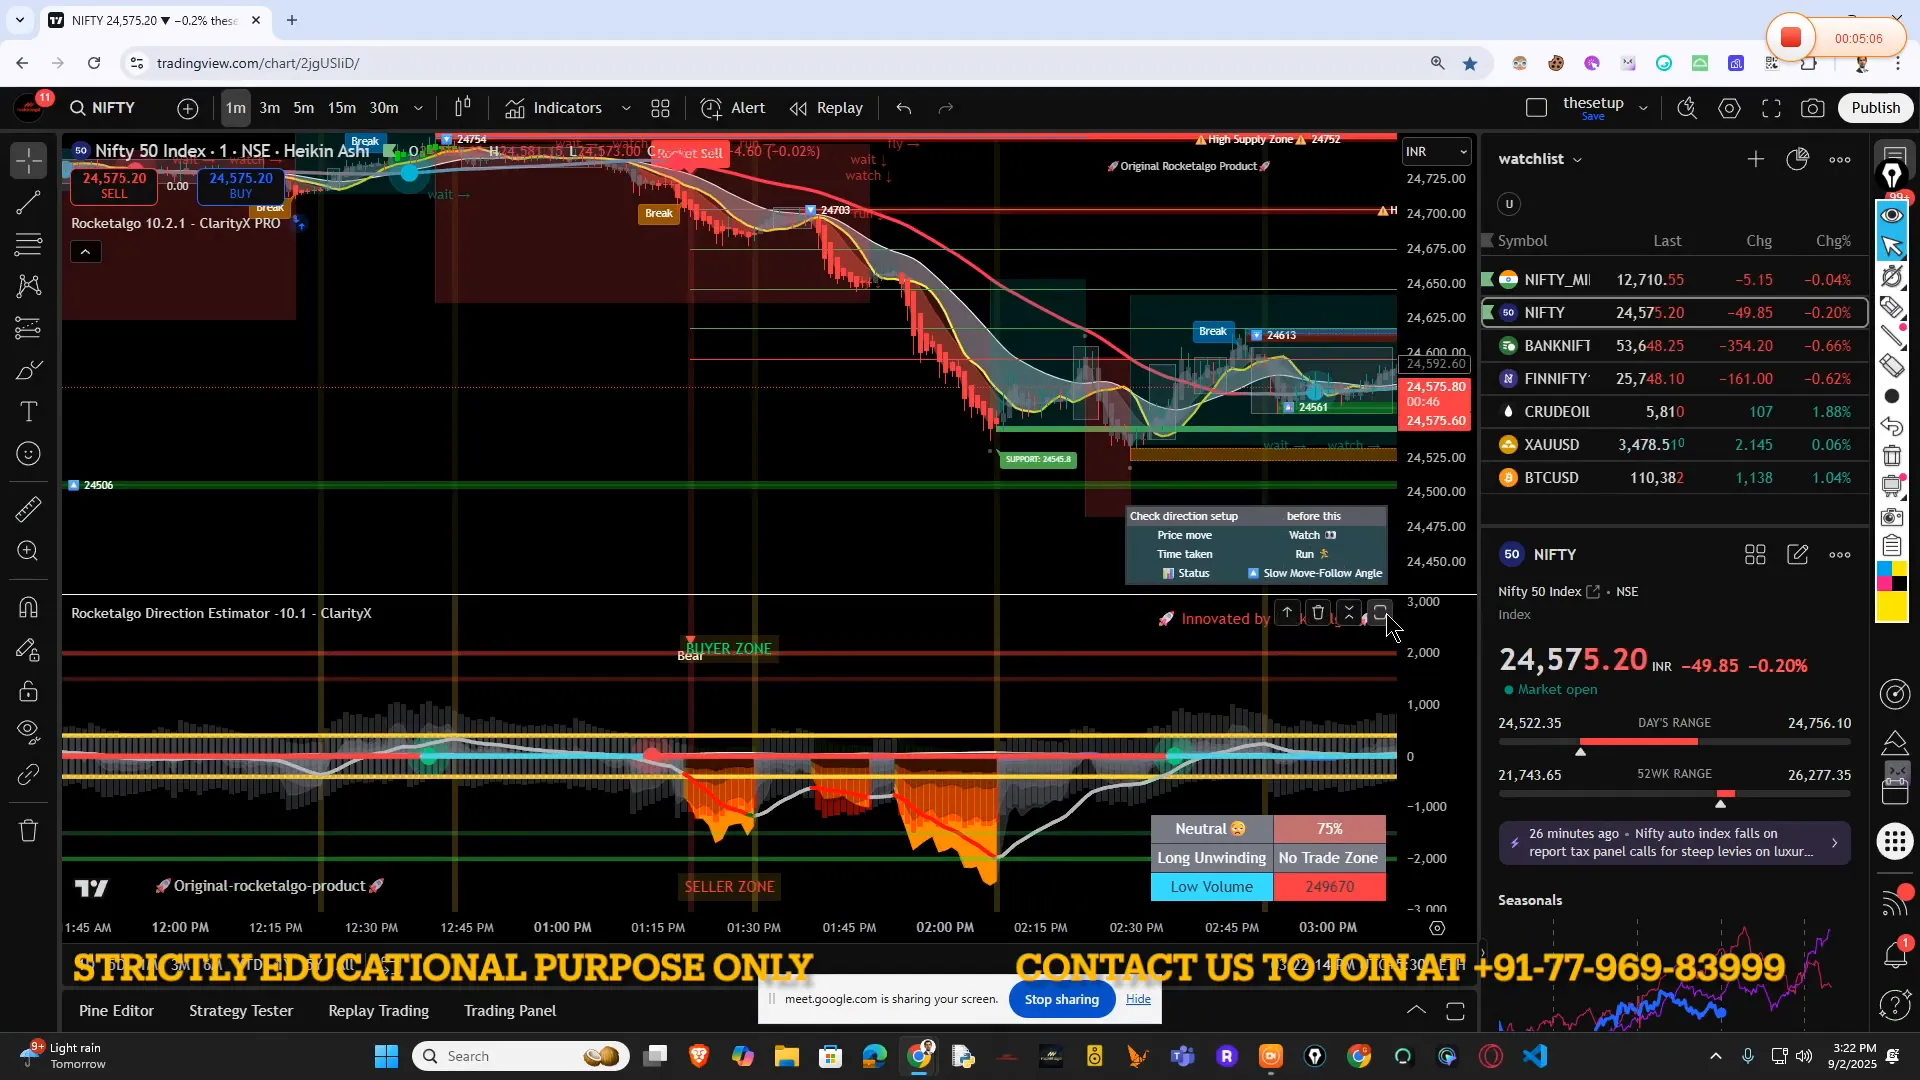
- Screenshot at 35:13 — A breakout example with targets and contract numbers. Observe the placement of stop, target, and how the ABCMP confirmation lined up before we increased size.
- Screenshot at 43:23 — Proof-of-concept profit screenshot showing successful trade capture. Use this to reflect on trade management, not as a guarantee.
⚖️ Risk management: what I emphasized during the session
Risk management is the backbone of sustainable trading. During the live talk I repeatedly reminded viewers that no single indicator guarantees success. Here are the practical risk rules I recommend when using Anpush dot logic on trading, stock market, NSE, BSE, Nifty instruments:
- Size appropriately: Never risk more than a small fraction of your capital on a single trade. Use stop-losses and consider maximum daily drawdown thresholds.
- Pick clear levels: Place stops beyond clear market structure (not just arbitrary pips) so you’re accounting for normal noise.
- Use time-based exits: If a trade doesn’t work within a defined window (e.g., the next 1-2 sessions for intraday setups), reassess and consider exiting.
- Journal every trade: Document entry, exit, dot color, ABCMP confirmation, and lessons learned. Over time you’ll see statistical edges and weaknesses.
- Safeguard capital: Consider smaller size around major events like policy announcements or high-impact data released domestically (which affect NSE/BSE markets heavily).
These guardrails are particularly important when trading instruments tied to trading, stock market, NSE, BSE, Nifty because those markets can move quickly on macro news or derivative flows.
📊 How to combine Anpush with other tools
Anpush is best used alongside price structure tools, basic momentum indicators, and order-flow context. Here’s a short, practical checklist of combinations that worked well in my examples during the session:
- VWAP + Anpush: VWAP gives institutional reference; the dot color shows whether volume distribution supports moves away from VWAP.
- Moving averages (short-term) + Anpush: Helps filter noise — for example, a green dot above a rising short MA increases confidence.
- Pivot levels and market profile: Use visible pivots to define targets and risk zones; dots clarify whether the market is likely to respect these pivots.
- Order-flow or tape reading (if available): When Anpush signals and tape shows aggressive buying, the trade’s probability improves.
Blending these tools increases conviction when trading the trading, stock market, NSE, BSE, Nifty instruments and helps you avoid acting on isolated signals.
🧠 Expectations & psychology — staying grounded
During the session I made a light-hearted comment — “it’s a joke” — about expectations because managing trader psychology is as important as the signal itself. Some days the dots will be perfect, other days they will be noisy. Key mindset rules I emphasized:
- Embrace small edges: Anpush is a probabilistic tool. Small per-trade edge compounded over many trades leads to consistent outcomes.
- Avoid revenge trading: If you have a losing sequence, step back and review the setup rather than chasing losses.
- Be process-focused: Review the process metrics (adherence to ABCMP, size discipline, stop placement) rather than obsessing over daily P&L.
When you combine discipline with a repeatable process, the dots become a consistent part of your toolkit for the trading, stock market, NSE, BSE, Nifty arenas.
🔁 Trade lifecycle: from signal to exit
Here’s an example lifecycle you can practice with paper trading:
- Signal: A green dot emerges on the 5-minute chart while the 15-minute is in a gentle uptrend.
- Confirm: ABCMP checks out — breakout on volume, momentum aligned, structure supportive.
- Entry: Enter on a clean breakout retest or on a momentum candle, depending on your plan.
- Stop: Place stop below the recent swing low or below the consolidation range.
- Target: Use measured moves, pivot points, or a trailing ATR-based stop to manage the exit.
- Exit rules: If price returns and invalidates structure, exit. If price reaches target, decide whether to scale out and trail.
This lifecycle works well across multiple instruments including indices or stocks on trading, stock market, NSE, BSE, Nifty where clarity of structure and volume context are crucial.
📌 Common pitfalls and how to avoid them
From the live session I summarized common mistakes traders make when adopting any new indicator, including Anpush:
- Overfitting past examples — thinking every pattern will repeat exactly. The market evolves.
- Ignoring context — applying the dot logic without checking timeframe alignment or macro news.
- Skipping risk rules — size too big or moving stops irrationally.
- Switching rules too frequently — give a consistent approach time to demonstrate edge.
Address these by journaling, running forward-testing in a demo environment, and gradually scaling into live trades as confidence grows.
🎯 Practical checklist for your trading day
Here’s a concise checklist I recommend before you trade any session when using Anpush on trading, stock market, NSE, BSE, Nifty instruments:
- Review macro calendar and news for the day.
- Identify major intraday levels: previous day high/low, VWAP, pivot levels.
- Load Anpush and observe dot patterns across your chosen timeframes.
- Run ABCMP checks on any candidate setup.
- Define risk, entry, and target before placing the trade.
- Document the trade outcome and lesson at the end of the session.
❓ Frequently Asked Questions (FAQ)
Q1: Is Anpush dot logic a standalone system?
No. Anpush is a confirmation and signal-refinement tool. It’s designed to complement price-action, structure, and standard risk management techniques. Use it alongside your existing toolkit for better probability assessment when trading the trading, stock market, NSE, BSE, Nifty instruments.
Q2: What timeframes work best with Anpush?
We commonly used 5-minute and 15-minute charts in the session for intraday trading. However, Anpush can be applied across multiple timeframes for swing setups too. Match your timeframe to your holding period and trading style.
Q3: How does ABCMP help reduce false signals?
ABCMP checks structure, breakout validity, momentum, price acceptance, and alignment with other cues. It’s a lightweight filter that requires multiple confirmations before a trade — this reduces acting on isolated dots and lowers false positives when trading the trading, stock market, NSE, BSE, Nifty instruments.
Q4: Can I automate trades using Anpush?
Technically yes, if you have the infrastructure to translate dot outputs and ABCMP checks into executable rules. But I recommend starting with manual execution to understand the nuances before automating. Market microstructure and contextual judgment still matter.
Q5: How do I adapt Anpush to Nifty or other index futures?
Use the same rules: observe dots relative to VWAP and structure, apply ABCMP, size appropriately, and respect event risk. Index futures often have strong derivative flows, so pay special attention to sudden jumps and expiry-related volatility when trading the trading, stock market, NSE, BSE, Nifty instruments.
Q6: Where can I practice before using real money?
Use a demo account or paper trading environment. Replay sessions and backtest the dot outputs against historical intraday data. Over time you’ll build a statistical understanding of what dot sequences tend to produce in the trading, stock market, NSE, BSE, Nifty context.
🔚 Closing thoughts — what I want you to take away
In the 2nd September 2025 session I meant to convey a few simple truths: indicators are tools, not oracles; volume profiling offers valuable context, and clear process + risk management beats hunches. Anpush dot logic condenses volume experience into an easy-to-interpret visual cue, and when paired with ABCMP and robust trading rules, it becomes a practical part of an intraday trader’s toolkit for trading, stock market, NSE, BSE, Nifty instruments.
If you’re curious to try Anpush, start small, journal everything, and combine its outputs with price structure and risk discipline. Practice is where statistical edges become personal edges.
Thanks for reading. If you want more learning resources, check our learning portal and guides that I referenced in the session. Trade safely, and keep the process simple and consistent.
📚 Additional resources and keywords to explore
To deepen your knowledge, look up terms and tools related to:
- Volume profiling and Market Profile
- VWAP and intraday pivots
- Order flow and tape reading
- Position sizing and volatility-based stops
- Backtesting and forward testing methodologies
Keywords that may help in further searches: trading, stock market, NSE, BSE, Nifty, volume profiling, intraday strategy, automated trading, ABCMP confirmation, dot logic, risk management.
Need more help |
|
Contact us by clicking the button below |
|
Click me |

