Hello — I’m Aditya from Rocketalgo Official. In this session I’ll walk you step-by-step through the exact approach my system used on 20th August 2025 to find high-probability stock momentum setups. If you follow trading, stock market, NSE, BSE, Nifty patterns like I do, this write-up will give you a practical, repeatable way to scan, shortlist, and act on opportunities — without guessing, without noise.
Table of Contents
- 📋 What you’ll find in this article
- 🔎 The simple principle that most traders ignore
- 🛠️ How Rocketalgo scans and produces a shortlist
- 📈 Live example: Paytm — how the scanner caught a move
- ⏱️ Multi-timeframe timing and the three market parameters
- 💡 Live example: Infosys — multi-timeframe bounce
- 🔁 Live example: TCS — momentum captured at the right time
- ⚖️ Watchlists — how to build and manage one (my exact method)
- 🔁 Both directions — we capture up and down momentum
- 📌 Why certain times have less momentum — and what it means
- 🧠 Practical psychology: stay calm, trade the plan
- 🧭 Example: Lodha — medium to high volatility opportunity
- 🛡️ Why automation and professional research matters
- 🧩 Common trader mistakes and how to avoid them
- 🧾 My simple checklist for every scanner signal
- ❓FAQ — Frequently asked questions
- 🧾 Quick checklist you can copy now
- 🔁 Closing thoughts — how to build confidence with this method
- 📣 Final notes and invitation
- ✅ Quick reference — where to start right now
- 🧾 Extended FAQ and practical answers
- 📌 Final reminder
📋 What you’ll find in this article
- A short, clear framework: the three market parameters that matter.
- How our Rocketalgo scanner finds stocks — the logic and automation behind it.
- Live examples from today: Paytm, Infosys, TCS, Lodha and more with timestamps.
- How to build and maintain a watchlist and why timing matters.
- Common misunderstandings, mistakes traders make, and how to avoid them.
- FAQ section answering practical questions about setups, risk, and follow-through.
Throughout this article I’ll use real examples and exact moments from the session so you can replicate the process on the trading floor or at home. I’ll also include screenshots tied to timestamps so you can visually match the setups as you learn.
🔎 The simple principle that most traders ignore
Markets move in ways that are not random — but many traders miss the important pattern. Here is the core principle I rely on and I told the group today: when the broader market is in a range or is weak (less overall momentum), individual stocks — especially well-chosen stocks — often produce sharp, isolated moves. Those moves are high-probability trading opportunities.
In other words: even when NIFTY or the general indices have low momentum, individual stocks (often midcaps or large liquid names) can still display sudden moves up or down. That’s where our scanner adds value: it hunts those isolated movers so you don’t have to.
Remember: trading, stock market, NSE, BSE, Nifty conditions are always driven by three parameters — time, price, volatility. Miss any one of them and your trade may not work. I’ll explain how to use all three.
🛠️ How Rocketalgo scans and produces a shortlist
Let me be transparent — everything we do here is technical and automated. I do not manually type in names. Our system runs a Python-based engine with multiple libraries and sixteen filters (criteria) that together pick the stocks worth watching for that day.
Key points about the scanner:
- It scans the NIFTY 500 universe, not just random or illiquid names.
- 16 criteria must match for a stock to appear in the shortlist — that reduces noise dramatically.
- It looks for both buying and selling momentum — we don’t only hunt long trades.
- Every recommendation comes with a timestamp and a suggested level where a trade became relevant.
Because we automate this process, the scanner can log dozens of stocks, but we only act on those with clear momentum and clean levels. The entire idea is to give you a manageable watchlist, not an overwhelming list of tips.

📈 Live example: Paytm — how the scanner caught a move
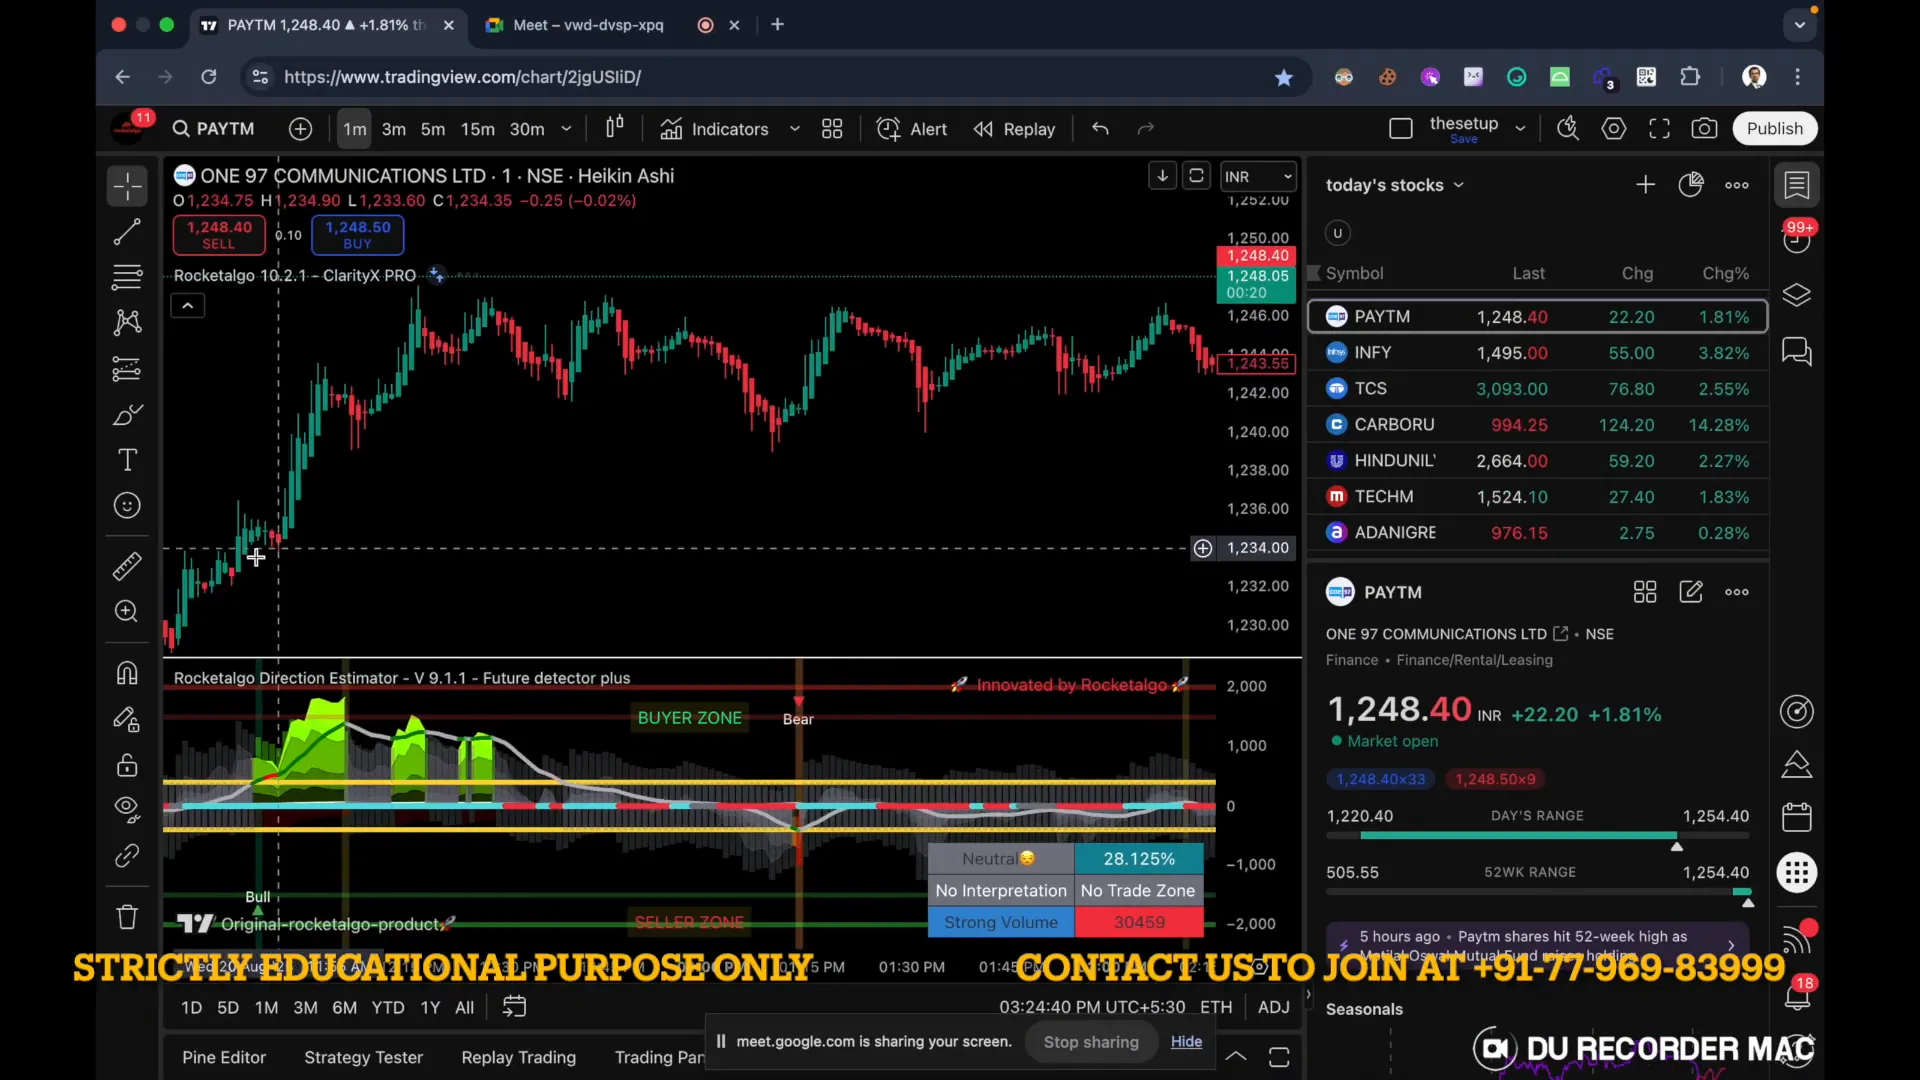
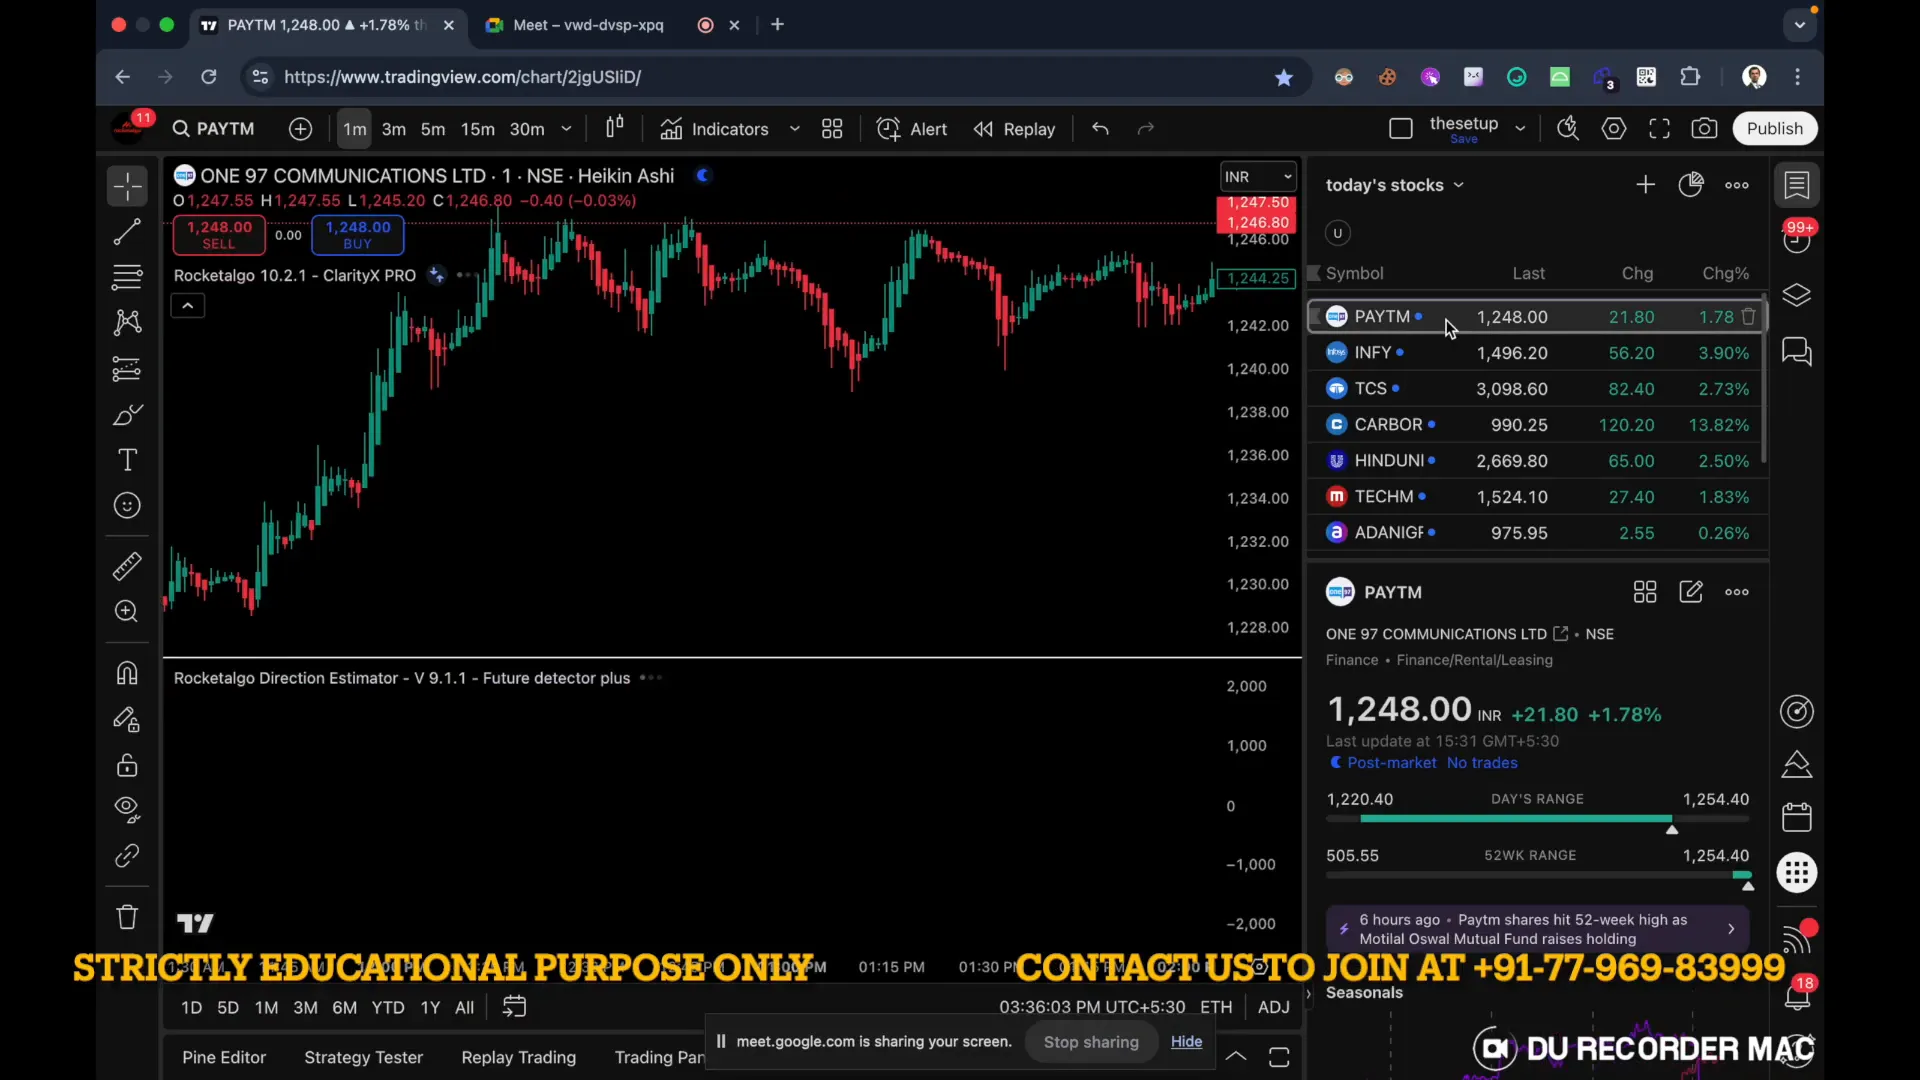
At 09:37 the scanner flagged Paytm around 1233.1. That level was not random — it was the result of our channel analysis and multi-timeframe checks. What happened next is the exact pattern we love: immediate bounce from that level, a short consolidation, and another push higher.
Why this matters:
- Paytm produced about Rs.12 move in a single session — that’s roughly a 1%+ swing in a stock of that size.
- Even when indices were weak, this stock had momentum. That’s the edge: you trade the stock, not the index.
- Had you kept this on your watchlist and monitored the scanner timestamp 09:37, you would have observed a clean entry area and multiple reasonable exit targets.
That’s exactly how the watchlist should work: scanner finds the level, you treat it as a candidate, and then you monitor price action around the level with your plan ready.
⏱️ Multi-timeframe timing and the three market parameters
Let’s re-state the three parameters simply because traders miss these all the time:
- Time — When is your setup signaling? An entry at 12:10 behaves differently than one at 09:10. Be precise with timestamps.
- Price — Which exact price level did the scanner highlight? Is it a support/resistance on higher timeframes too?
- Volatility — How fast did price move from the level? Two minutes? Six hours? Volatility determines how you size and hold the position.
Failing on any of these can ruin a trade. For example, entering 15 minutes after the scanner alerted you to a level is usually a bad idea — price may already have completed the move.
💡 Live example: Infosys — multi-timeframe bounce
Infosys showed up on the scanner around 1464 at 09:09. If you watch the chart, the entry level acted as a pivot and then price moved to ~1482. That’s roughly a 1–2% move — substantial in a liquid large-cap like Infosys.
Why this trade was reliable:
- The scanner matched the level across timeframes: the level mattered on both intraday and higher timeframes.
- Because we check multi-timeframe confirmation, noise is filtered out and the chances of false signals drop.
- Even if you took partial targets at 1% and trailed the rest, it’s a good risk-reward.

🔁 Live example: TCS — momentum captured at the right time
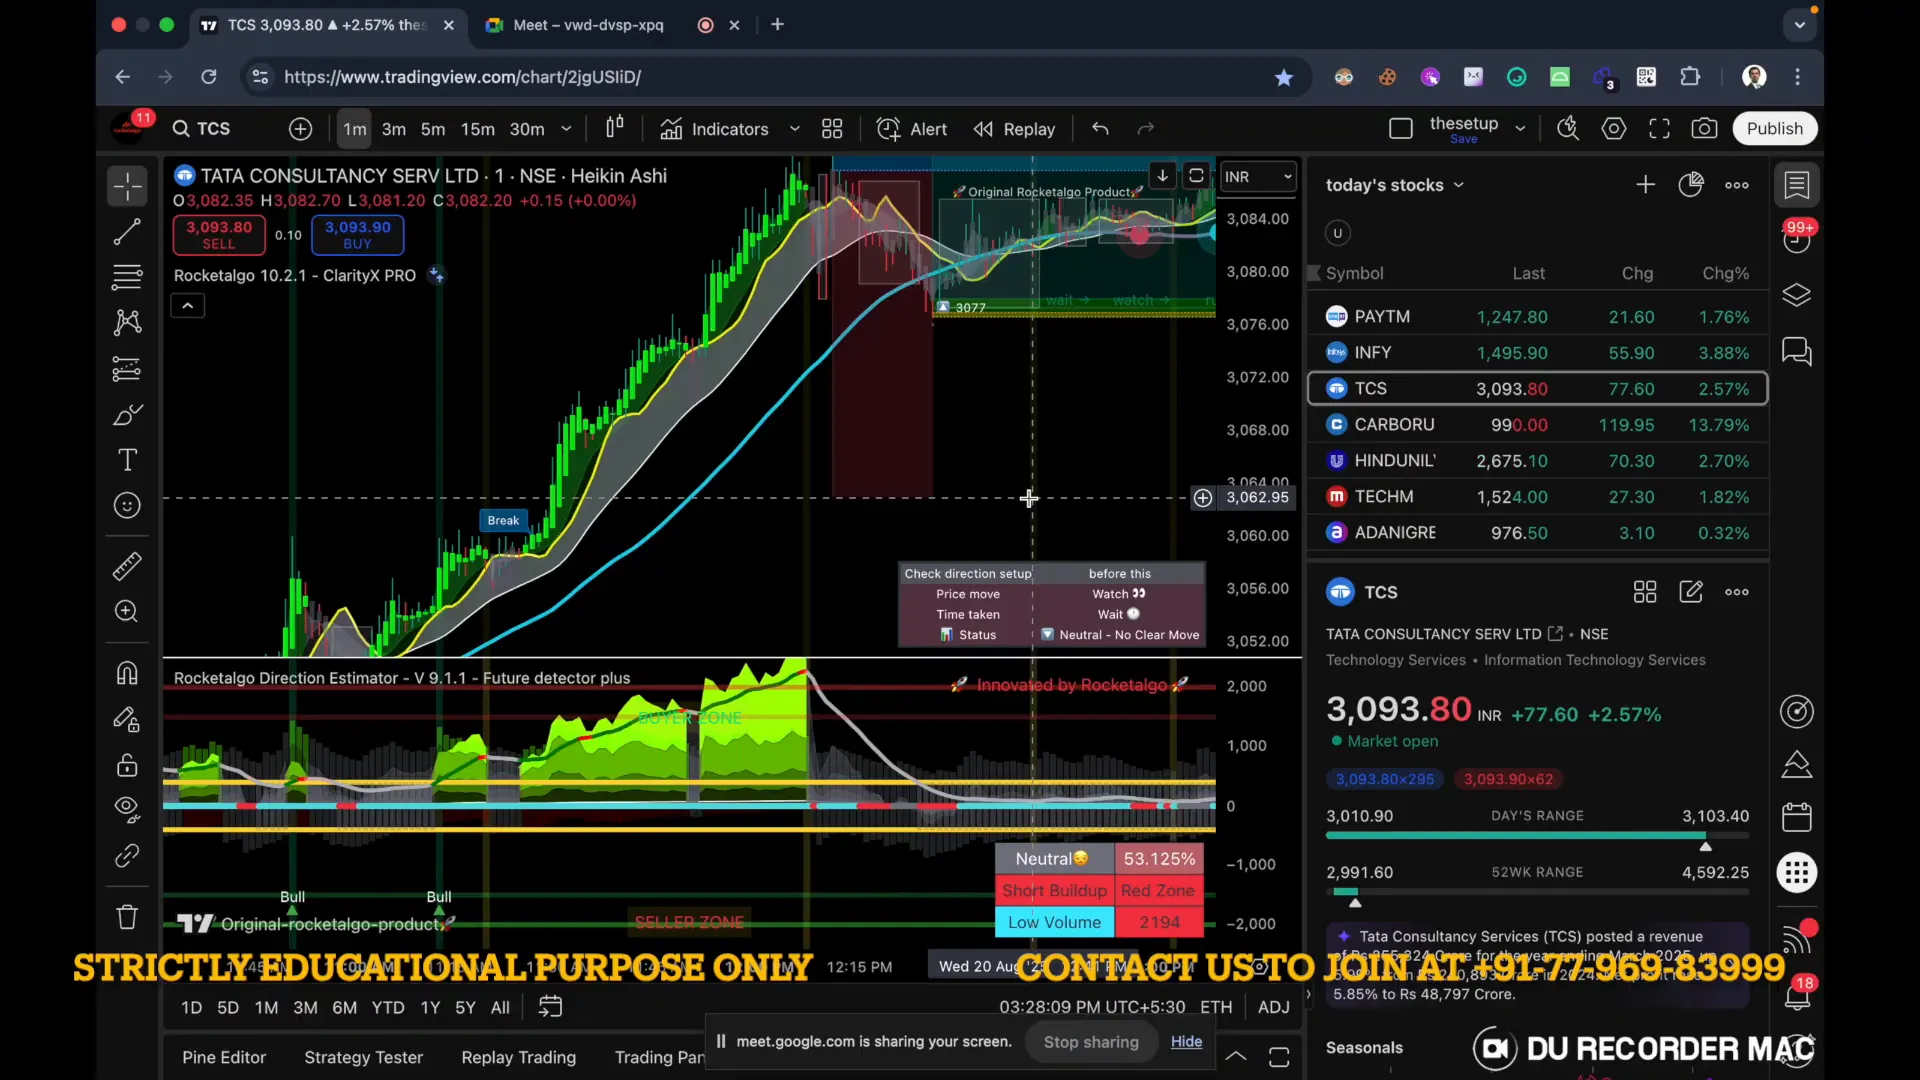
TCS was signaled at 3,059 at 11:16. After the signal, TCS moved to 3,089 at its short-term high. This is a textbook example of timing and volatility aligning: the scanner identified a level, price respected it, and volatility delivered the move quickly.
Important lesson: timestamp matters. I keep repeating this because if you check the signal an hour late, your edge is gone.
⚖️ Watchlists — how to build and manage one (my exact method)
Here’s the practical routine I recommended today, step by step. You can do this with a simple notebook or your trading platform.
- Every morning, run the scanner (or check the list it produces).
- Note down the names and their times and levels: e.g., “Paytm 09:37 1233”, “Infosys 09:09 1464”, “TCS 11:16 3059”.
- Put only the best 8–12 stocks into an active watchlist — too many is noise.
- Throughout the day watch price action around those levels; trade only when price validates the level (bounce, breakout, or clean rejection).
- Remove names that didn’t react — add others when the scanner produces fresh signals.
That’s it. Clean watchlist. Time-stamped levels. Quick action. No guesswork.

🔁 Both directions — we capture up and down momentum
A common misconception is the system only finds buy trades. Not true. Rocketalgo flags both buy and sell momentum. Today I showed long and short opportunities — TCS, Paytm, Infosys for up moves and other names for down moves. For example, Carbo (a smaller name mentioned in the session) showed a downtrend; scanner flagged it and it moved lower as expected.
Trade the direction the price confirms, not the direction you prefer. The scanner gives neutral signals: it highlights candidates only when our criteria match.
📌 Why certain times have less momentum — and what it means
There’s a pattern you must accept: after around 12:00–12:30 the market participants change. Manipulators, institutional flows, and the way participants behave often makes moves slower. That’s why signals around noon sometimes produce less follow-through.
Actionable tip: treat midday signals with caution. Either wait for confirmation or opt for smaller position sizes.
🧠 Practical psychology: stay calm, trade the plan
Calm mind, clear plan. Your scanner is a tool — your discipline does the rest.
One of the biggest lessons from the session: the market tests your patience. You can have world-class signals, but if you don’t follow time, price and volatility rules, results will be inconsistent. So: prepare, note timestamps, and trade the plan.
🧭 Example: Lodha — medium to high volatility opportunity
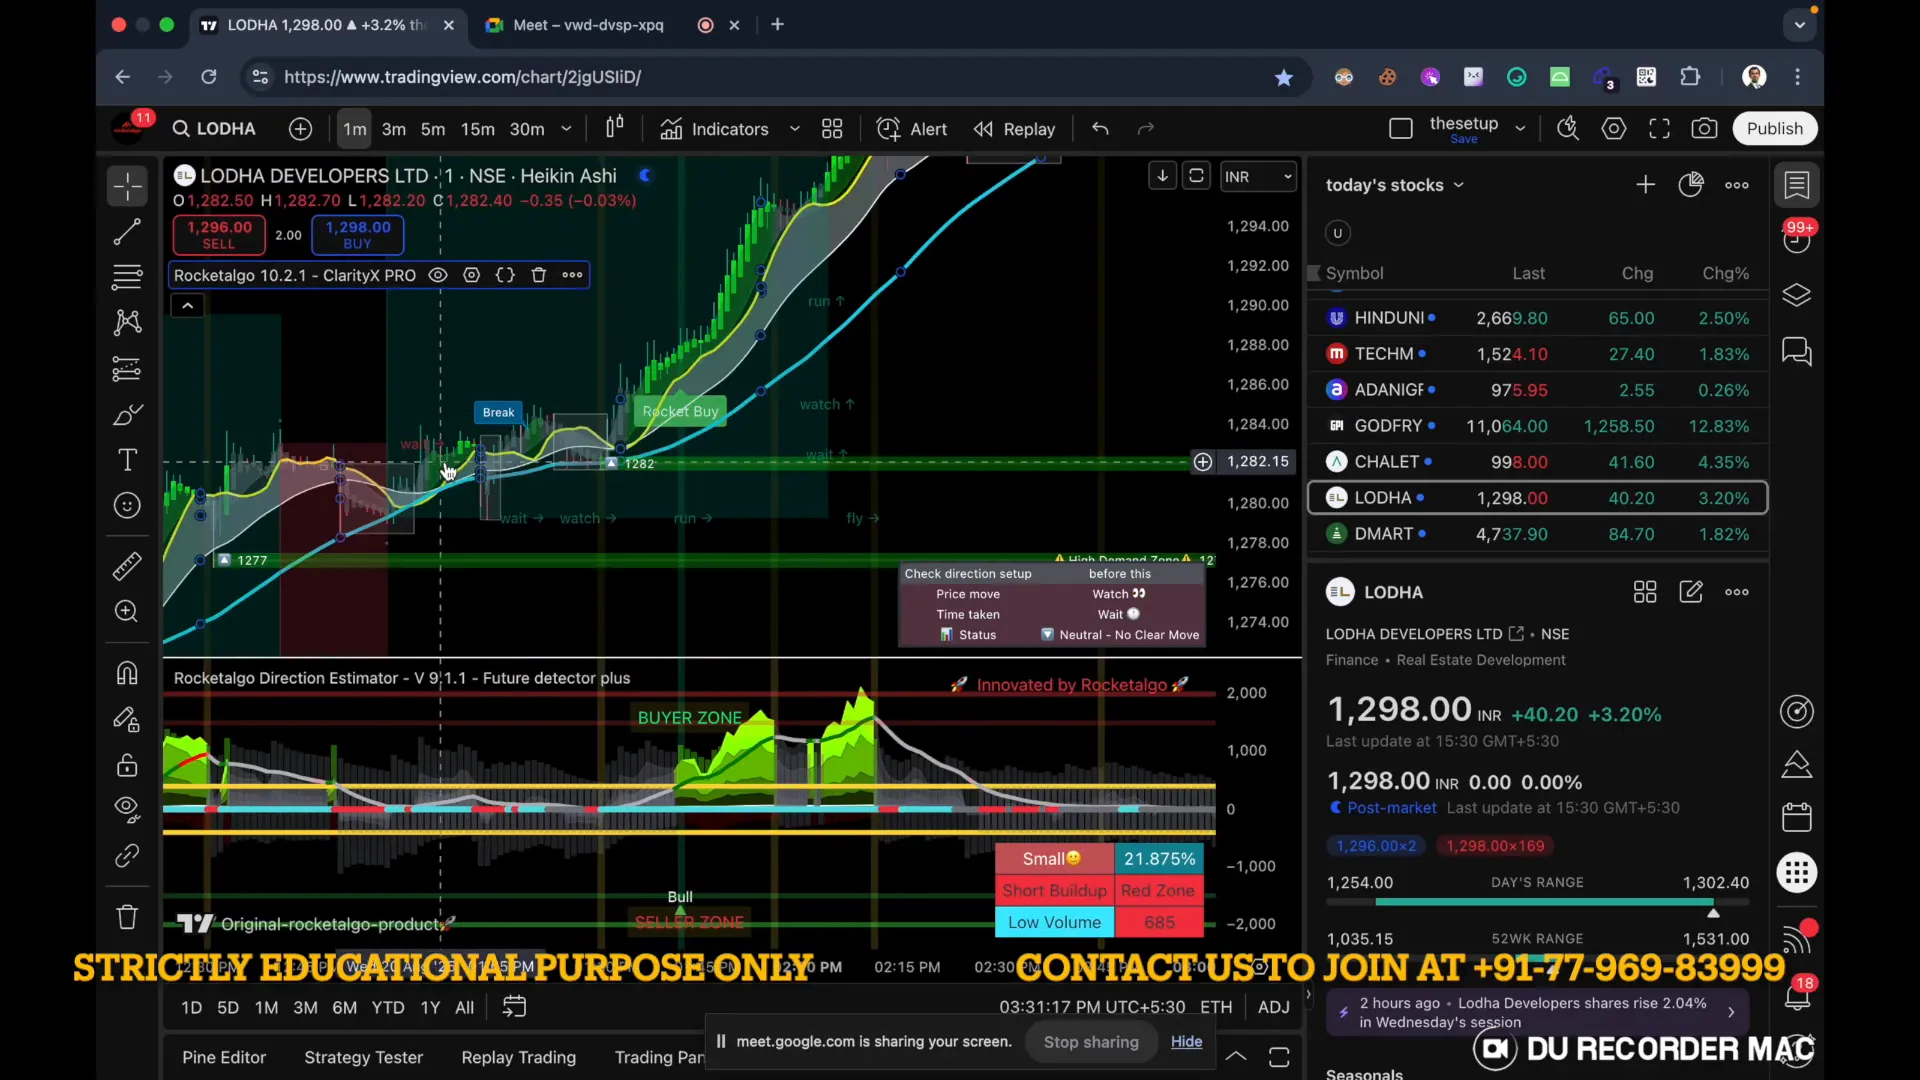
Lodha was flagged around 13:01 at ~4,749 (scanner timestamp). It showed clear intraday range behavior and then a directional leg. If you mapped the signal time to the chart you’d see the break-and-run pattern we teach in our channels. This was another example of our scanner finding opportunities across different sectors.

🛡️ Why automation and professional research matters
We are not guessing. We built a research team and hired international-grade developers. The engine runs through 500 stocks and applies sixteen carefully chosen criteria. When all criteria match, a stock is flagged. The result is a small list of high-probability candidates.
Why this adds value:
- Reduces emotional decisions — the engine applies objective filters.
- Works across timeframes — intraday and higher timeframe checks cut false signals.
- Lets you focus on execution, not on endless scanning.
🧩 Common trader mistakes and how to avoid them
Here are repeated mistakes I see and what to do instead:
- Entering late — If the scanner signals at 09:37, don’t wait till 10:30 to enter. Time reduces the edge.
- Not using multiple timeframes — A level that’s weak on multiple timeframes is not reliable. Use 1m/5m/15m and a higher timeframe confirmation.
- Ignoring volatility — If the move takes 6 hours, it’s a different trade than a 2-minute blast. Size and strategy differ.
- Chasing tips — Don’t follow random tips without understanding setup, timestamp, and level.
🧾 My simple checklist for every scanner signal
- Is the timestamp fresh? (within minutes)
- Does the price respect the scanner level on the chart?
- Is the move supported by volume/volatility?
- Do multi-timeframes agree?
- Is the trade size appropriate for expected volatility?
❓FAQ — Frequently asked questions
Q1: Does Rocketalgo only work on stocks or also on options/forex?
A: We started with stock scanning as our first, most robust feature. Later we expanded into options, forex and other instruments. Today, stock scanning remains a cornerstone because the signal clarity and liquidity in NSE/BSE names help create consistent trades.
Q2: How many stocks does the scanner scan and how many filters are used?
A: The engine scans the NIFTY 500 universe and applies 16 criteria. Only when all (or the necessary subset) match does a stock appear in the shortlist. That reduces noise and increases probability.
Q3: Why do some noon signals show less momentum?
A: Post 12:00–12:30, the market’s microstructure changes — participants and manipulators shift behavior, liquidity can thin, and moves can slow. We advise caution, smaller sizes, or requiring extra confirmation for midday signals.
Q4: Can I rely solely on the scanner? Do I need manual analysis?
A: Use the scanner as a powerful filter. You still must validate price action, manage risk, and execute properly. Automation finds candidates; human judgement manages trade execution.
Q5: Is this a recommendation to buy or sell?
A: No. Signals and education are provided for training and informational purposes. Always do your own research and consult advisors before trading.
🧾 Quick checklist you can copy now
- Open a notebook or your watchlist app each morning.
- Record scanner signals exactly as shown: stock, timestamp, level.
- Choose 8–12 names max and monitor live price action.
- Enter only on clear validation and follow your volatility-based sizing.
- Exit at pre-decided targets or use trailing stops.
🔁 Closing thoughts — how to build confidence with this method
If you want consistent results you need three things: a reliable scanner, a simple trading routine, and disciplined execution. Our scanner gives you the first; the rest is training. I’ve taught this method for years — stock scanning was our first feature and it still provides the most consistent opportunities across NSE and BSE listed stocks.
Takeaway in one sentence: follow time, price, and volatility precisely. Let the scanner give you the shortlist; let your plan do the rest.
📣 Final notes and invitation
I shared live timestamps and examples so you can match the voice to what we showed today. If you want hands-on guidance, we do offer mentorship and more structured training. We’re building an office and training space where you can come and learn in person — but before that, practice this routine: make the watchlist, timestamp every alert, and trade with discipline.
Thank you for reading and following my step-by-step method. If you adopt this approach — scan, shortlist, time-stamp, watch, trade — you will find trading is less noisy and more predictable. Remember the phrase: trading, stock market, NSE, BSE, Nifty — watch those parameters and trade the stock, not the noise.
✅ Quick reference — where to start right now
- Create a daily watchlist using the scanner output.
- Record stock name, timestamp, and scanner level in a notebook.
- Watch price action around those levels for confirmation.
- Use small size initially and measure results for two weeks.
🧾 Extended FAQ and practical answers
How to size positions on a scanner signal?
Use volatility: if the typical move from the level to a reasonable target is fast (minutes), use smaller size and tighter stops. If it’s a slower move (hours), position sizing can be slightly larger. Always cap risk per trade as a fixed percentage of equity.
Where to keep my watchlist?
Notebook, spreadsheet, or your platform. The important part is timestamping and cleaning the list during the day. We delete old lists in our servers after two days to keep data tidy — you can keep your own history for learning.
What about tips and random chatroom calls?
Ignore them unless they come with timestamped levels and multi-timeframe logic. Blind tips are the fastest path to losing money.
📌 Final reminder
Practice patience. Use the checklist. Respect time, price, and volatility. If you do this consistently, you will see improvement. And yes — the scanner works across both up and down moves; it’s not biased. Take care, trade safely, and keep the process simple.
Need more help |
|
Contact us by clicking the button below |
|
Click me |


